Modern planning teams operate in environments where speed, accuracy, and clarity directly influence outcomes. Consequently, the ability to filter your map data by any attribute becomes a core strategic skill. In high-growth sectors like EV infrastructure, teams often evaluate hundreds of potential locations before selecting only a few high-impact sites. While this process traditionally demands heavy manual effort, MAPOG streamlines the workflow with dynamic filtering that responds instantly to every condition you apply.
Key Concept: Filter Map Data by Any Attribute or Field
When you filter your map data by any attribute, you turn raw points into strategic insights. Although datasets often feel overwhelming at first, a smart filter flow creates clarity immediately.
Benefits
- Faster identification of commercially viable sites
- Higher accuracy through structured, attribute-level filtering
- Clear visibility for leadership and on-ground teams
- Reduced time spent on manual comparisons
Step-by-Step Process to Filter Map Data by Any Attribute or Field
1. Launch Your Mapping Project
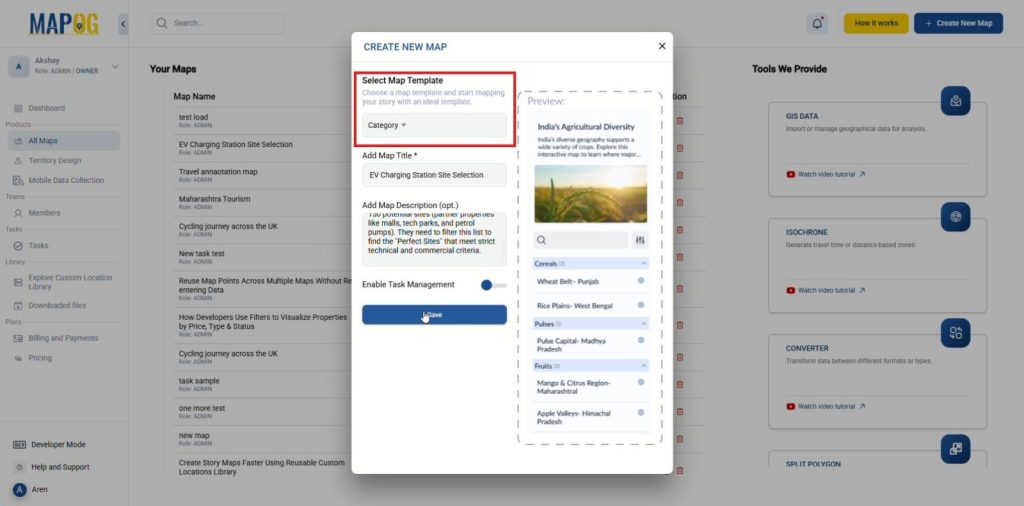
To begin, start by visiting MAPOG and selecting Create New Map. Next, choose the Category template, then enter your map’s title and description. After that, save your settings to establish your workflow foundation.
2. Set Up Location type and Upload CSV
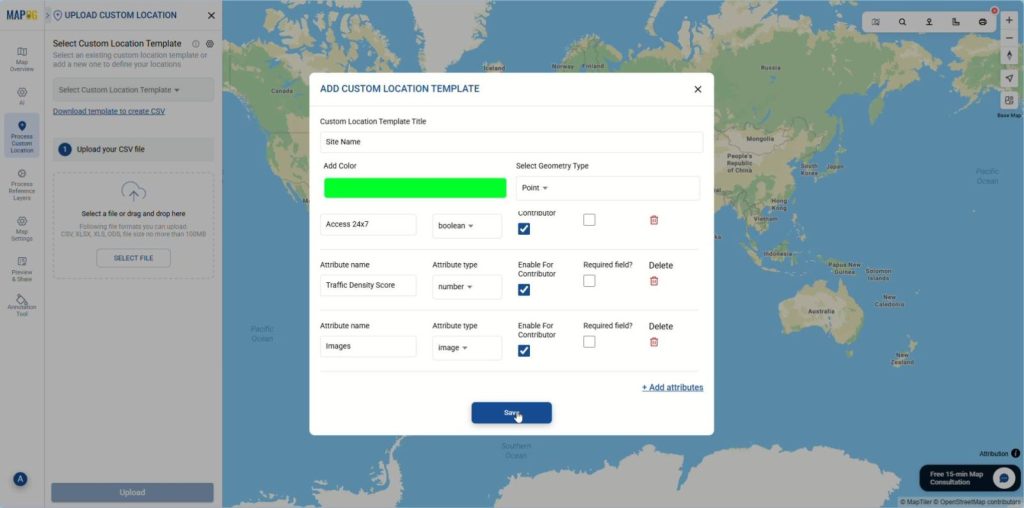
Following this, move to Process Custom Location and choose Add by uploading CSV/Excel. Then, open Select Custom Location Template settings and click on Add more custom location template to create a new location type, give it a suitable title, add color and select Point as geometry type. Subsequently, include essential attributes, save it and select it from the Select Custom Location Template drop down.
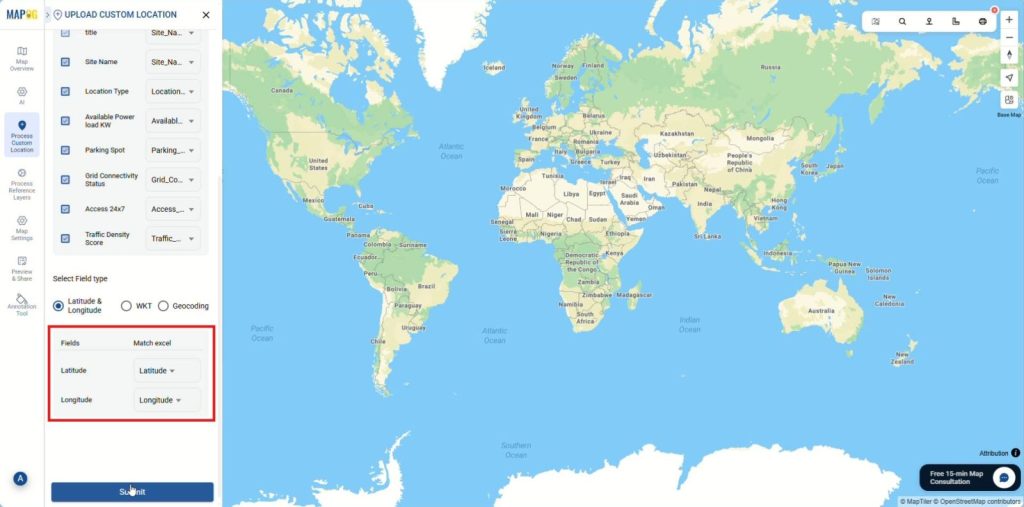
Afterward, upload the pre-existing CSV/Excel file then match all the attribute columns with the corresponding Excel columns, specify placement using coordinates or WKT format, and finally submit your data.
3. Organize by attributes
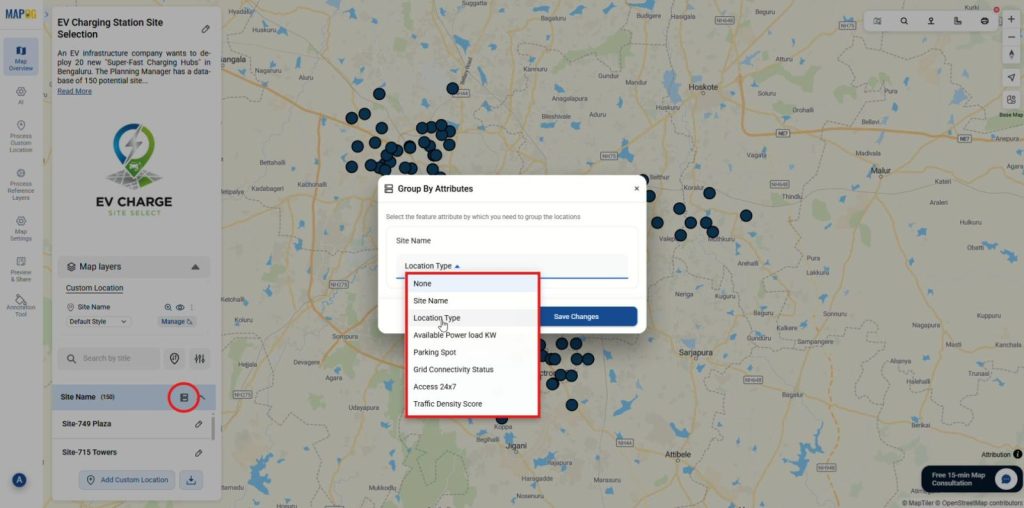
Once submission is complete, apply Group by Attributes to reorganize site locations based on an attribute field, this will automatically separates points into distinct categories using any attribute from the dataset thereby making patterns immediately visible.
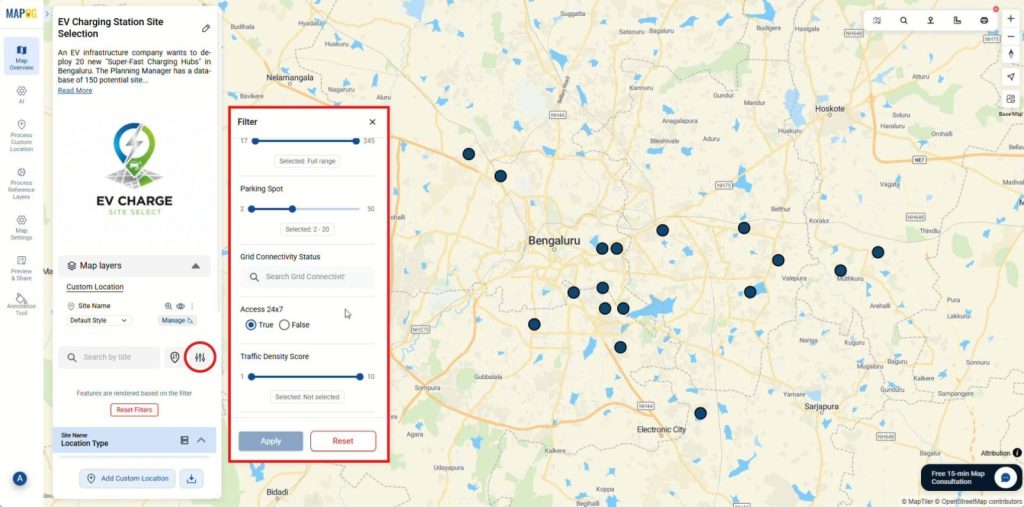
After grouping, locate and click the filter icon in the Map Layers panel to open the filter panel. Then, use sliders for numerical attributes like parking spots or traffic density scores, and select values from dropdown menus or toggle True/False options for categorical attributes such as Grid Connectivity Status or Access 24×7. Once configured, click Apply to refresh the map with filtered results.
4. Color code locations
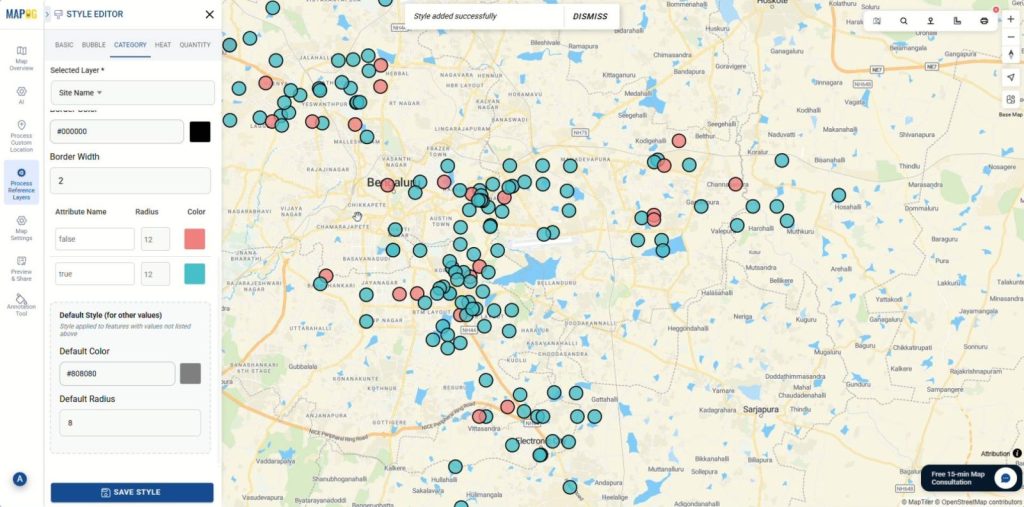
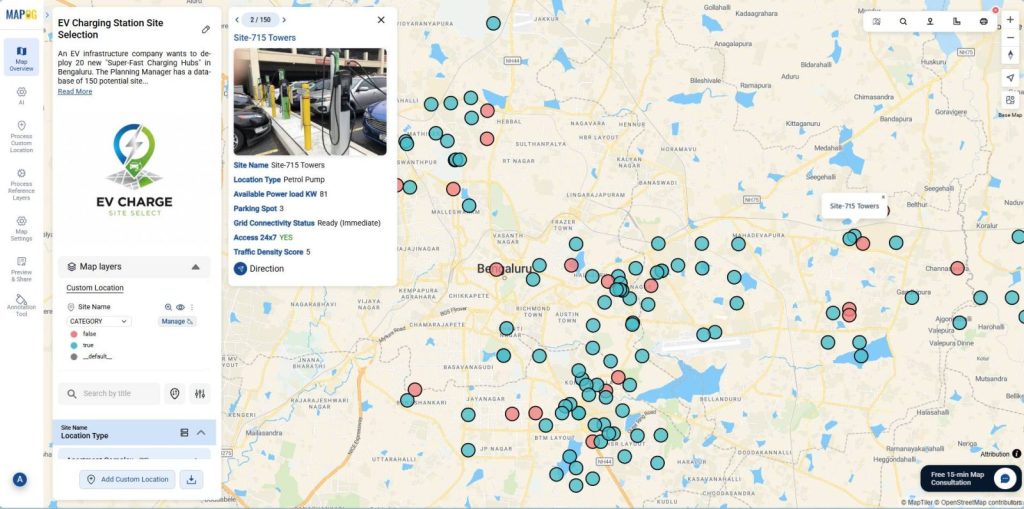
Finally, for better visualization use color-coding locations. First, access the Layer Panel, then select Add Layer Style, and within the category section, choose your attribute. Next, assign distinct colors to each group, and then toggle the legend in the layer panel for better interpretation.
Consequently, your map now delivers clarity, precision, and actionable insights instantly.
Industries and Domains Benefitting
A wide range of industries benefit from the ability to filter your map data by any attribute, including Electric Vehicle Infrastructure, retail and franchise networks, logistics and mobility services, telecom tower deployment, and real estate or urban planning. These sectors rely on fast, attribute-level filtering to identify the best locations, streamline decision-making, and improve operational efficiency.
Conclusion
Data-heavy decisions demand clarity, and MAPOG delivers that clarity through dynamic filtering that evolves with every attribute you select. When you truly learn how to filter your map data by any attribute, you move faster, choose better, and build stronger location strategies with confidence.