In today’s world, mapping platform vs traditional maps is a common debate, meanwhile where technology drives nearly every decision, the way we view and use maps has transformed dramatically. Historically, traditional maps once served as our primary guides offering static representations of geography, routes, and landmarks. However, with the rise of modern mapping platforms like MAPOG, maps have evolved far beyond being visual aids; they’ve become dynamic, data-driven tools for analysis, planning, and decision-making.
This evolution isn’t however just about shifting from paper to screen; it’s about turning location data into actionable insights. Modern platforms now integrate real-time data, user interaction, and advanced geospatial analysis, creating a bridge between visualization and understanding.
From Paper to Platform: The Evolution of Mapping
Traditional maps were limited by their format. Once printed, they couldn’t adapt to new information, traffic updates, or location changes. They provided fixed reference points; perfect for navigation but insufficient for dynamic decisions. Mapping platforms, in contrast, are interactive and continually updated. They also allow users to create, edit, and share maps in real time, enabling flexibility that traditional maps could never offer.
Key Differences Between Traditional Maps vs Mapping Platform
The distinction between traditional maps vs mapping platform also lies in how they handle data, interaction, and analysis. Traditional maps are however static, offering limited user control and no scope for real-time updates. In contrast, mapping platforms are dynamic, allowing users to manipulate data, visualize changes, and access constantly refreshed information.
How Mapping Platforms Like MAPOG Work
MAPOG stands out as a versatile and user-friendly platform that helps users visualize, analyze, and share spatial data effortlessly. Whether for urban planning, logistics, or tourism, such as creating an interactive map of all metro stations in a city with timings and details.
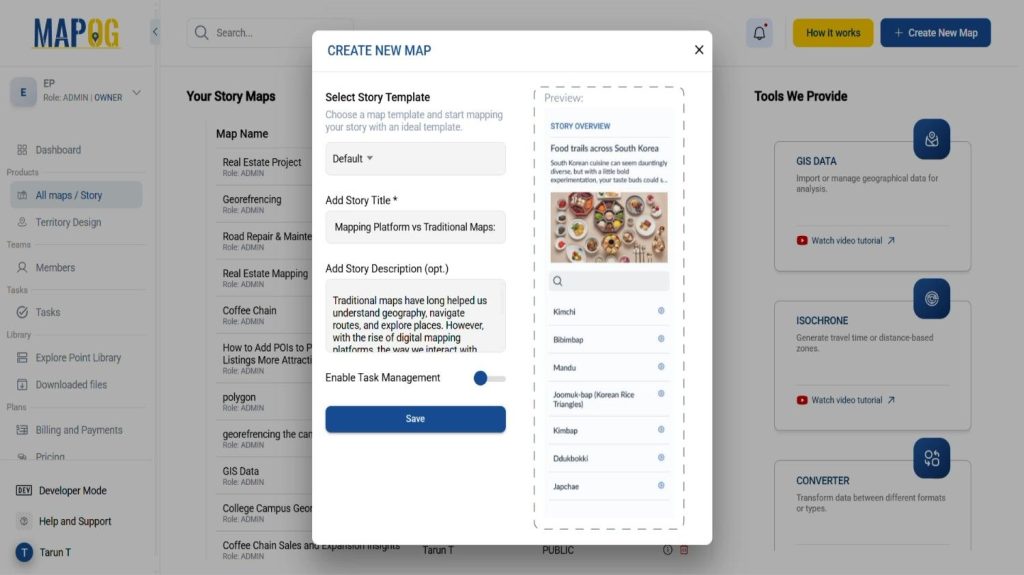
Create a New Map
- Click “Create New Map” on MAPOG.
- Add a title, description, and also an image that represents the map theme.
- Save your map.
Add Map Data
- Add the Point data using Add Story
- Upload the data using Add by uploading Excel/CSV feature.
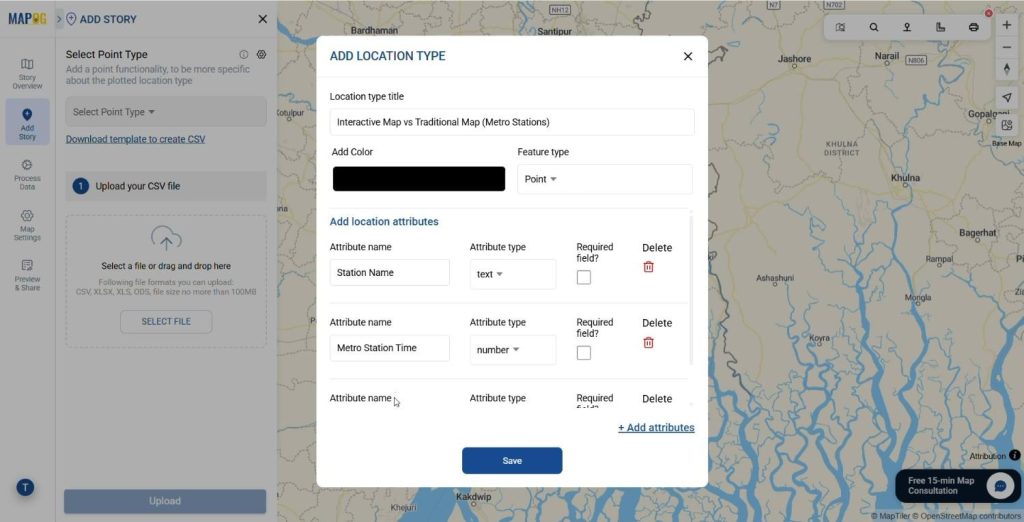
- Then click on select point type and add the location type.
- After adding the location type Add the attributes like Metro Station Name, Address, description etc.
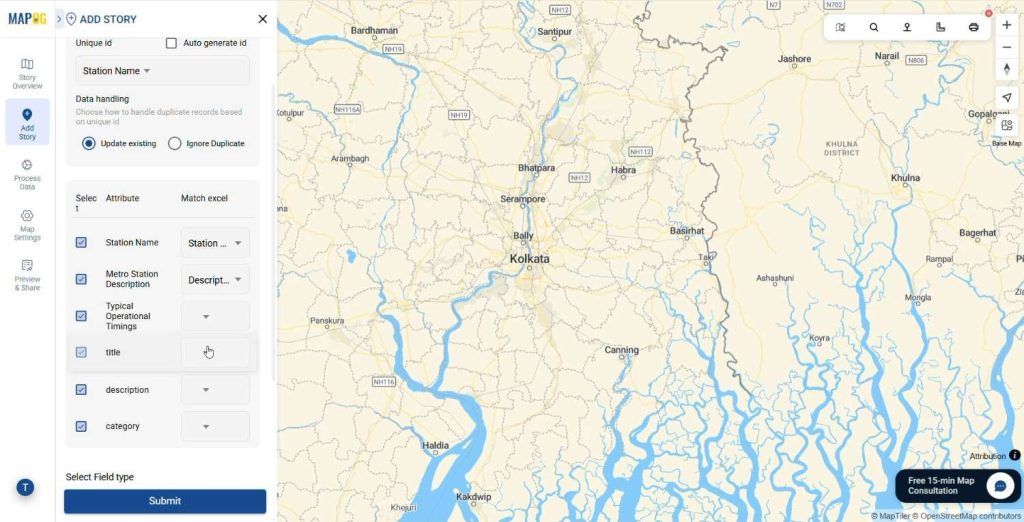
- Match the Attribute Values to Excel Columns like Metro Station Name, Address,description etc.
- Add the latitude and longitude of the points from the table and click Save.
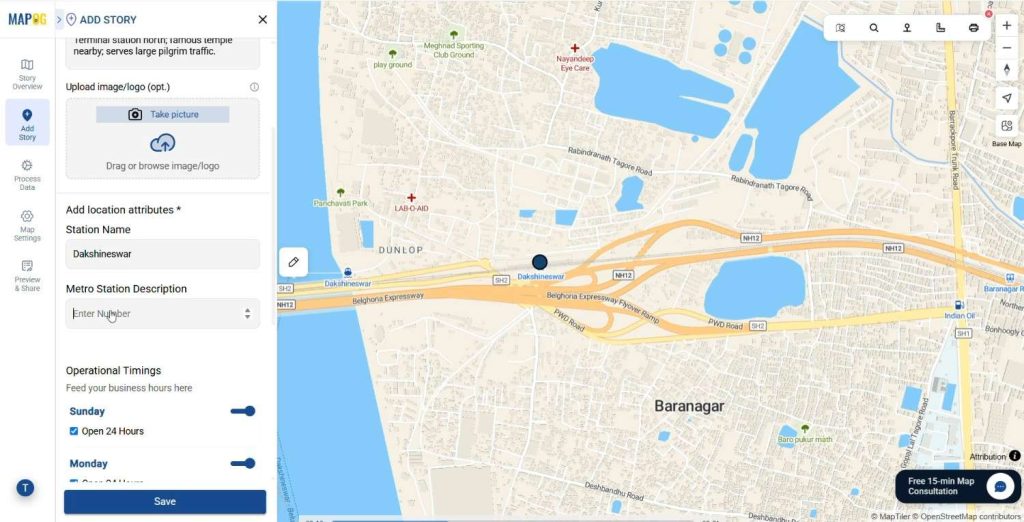
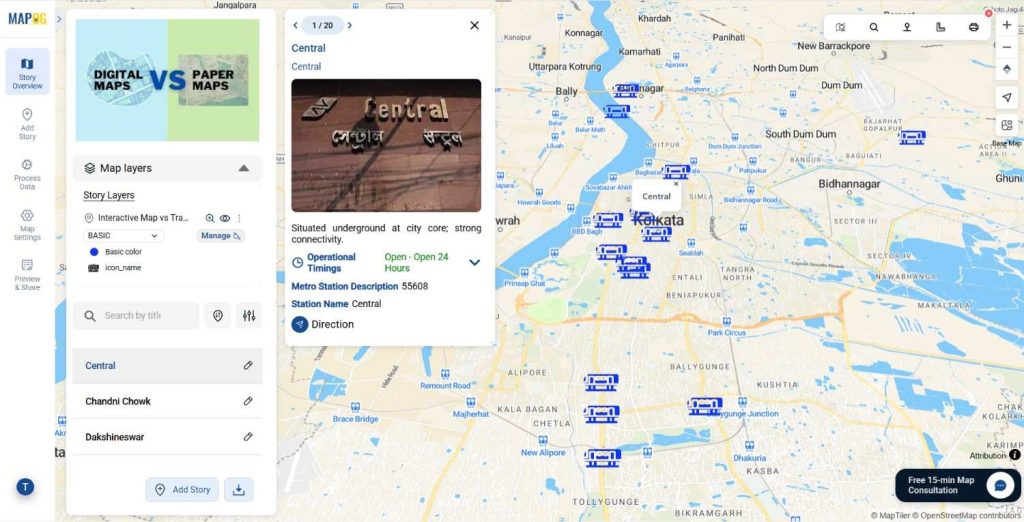
Add Details
- Go to edit point details & add or edit necessary details regarding the map.
- Upload images or graphics if needed for easier identification.
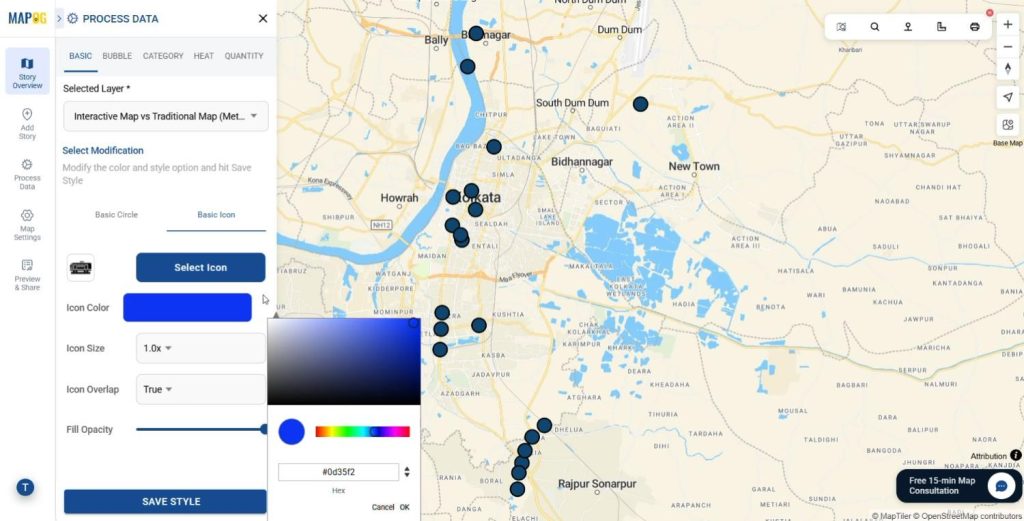
Customize Markers
- Next click on the Add Layer Style and style the Map layer.
- Significantly use different icons and colours or visual aids to represent different points.
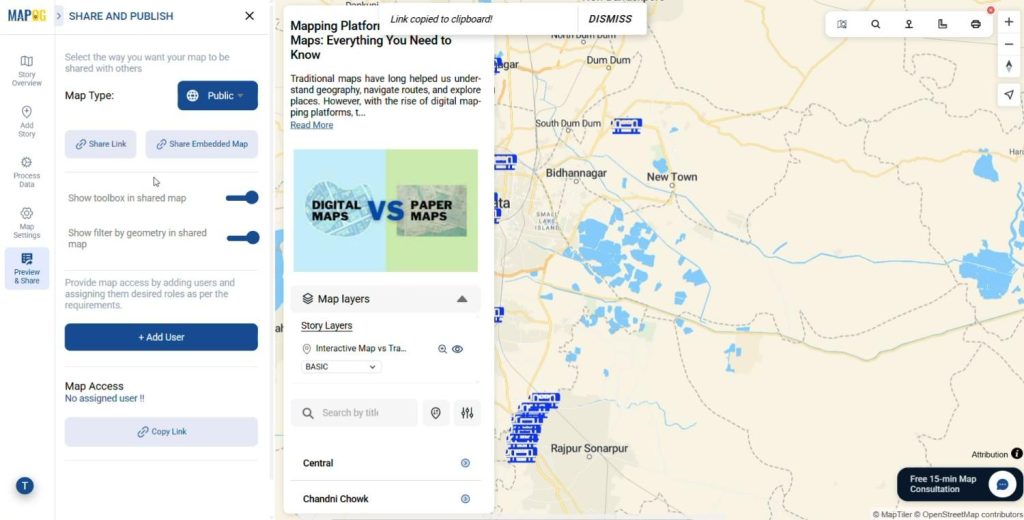
Preview & Share
Use the Preview and share option to review your map. Share it with local authorities, map enthusiasts, or community groups to enhance their map knowledge.
Through its intuitive tools, users can convert raw data into visually meaningful maps. Sorting, measuring, or filtering points of interest becomes effortless, turning static datasets into interactive and decision-ready visuals.
Mapping Platform vs Traditional Maps: Applications Across Industries
Mapping platforms have found applications across nearly every field. In urban planning, they help assess the accessibility of essential services such as hospitals, schools, and transport hubs. Emergency services can quickly locate the nearest hospitals or fire stations during crises. In logistics and business, they streamline deliveries and optimize customer reach.
Mapping Platform vs Traditional Maps: The Future
As technologies like GIS, AI, and cloud computing advance, mapping platforms will continue to become more predictive, adaptive, and personalized. Future maps might respond dynamically to real-time environmental changes or user behaviour, delivering insights tailored to individual needs. Traditional maps laid the foundation, but MAPOG is building the intelligent, connected future of mapping.
Conclusion
Whether you’re planning a route, analyzing business locations, or studying your city’s development, tools like MAPOG help transform raw location data into meaningful, interactive insights that make decision-making smarter and faster.
Have you tried creating an Modern Interactive Map ?
Share your thoughts and experiences in the comments!