In the real estate industry, clients often struggle to understand brochures or flat layouts because they don’t provide enough clarity about building height, structure, or availability. 3D Building Maps can enhance communication by providing realistic height visualizations, property details, floor plans, and furnishing status for buildings. MAPOG make this process more intuitive through features such as Add Manually and Style Customization, ensuring that your map is not just functional but visually engaging too.
Key Concept of Creating 3D Building Maps
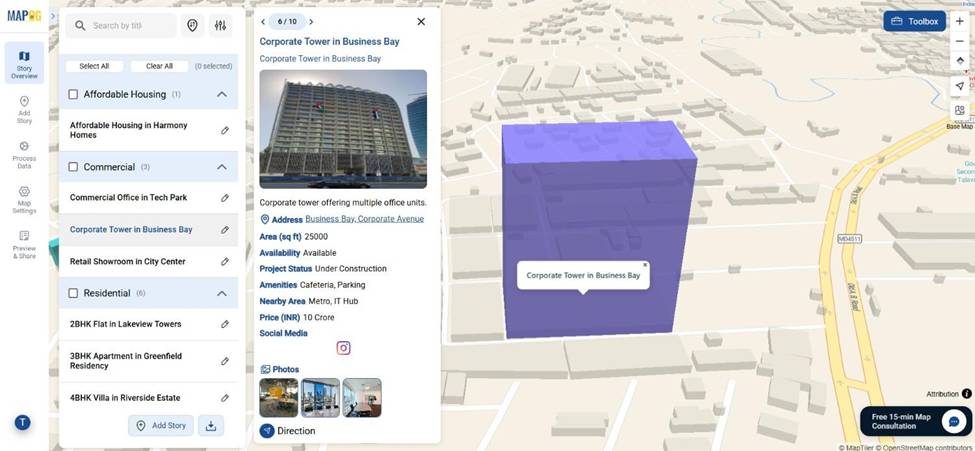
So, The idea behind Creating 3D Building Maps is to bridge the gap between technical plans and client understanding. Instead of static brochures, an interactive 3D map can highlight floor availability, property images, pricing, and other critical details. This visualization offers a stronger perspective on projects and encourages more confident decisions. For example, when a prospective buyer can rotate, zoom, and view the height of a building, the value of the project becomes clearer.
Real Estate Project as a Use Case
To explain the process, let’s take a Real Estate Project map as an example. Map a residential complex in 3D, adding attributes like furnished or under construction status, floor price, and available units for a client-ready visualization.This becomes a living, interactive project map instead of a static presentation. MAPOG allow you to start with Add Manually, customize polygons for buildings, and then finish with Style Customization to create height, color, and pitch adjustments for a real 3D effect.
Process of Creating 3D Building Maps
Step 1: Adding Buildings Manually
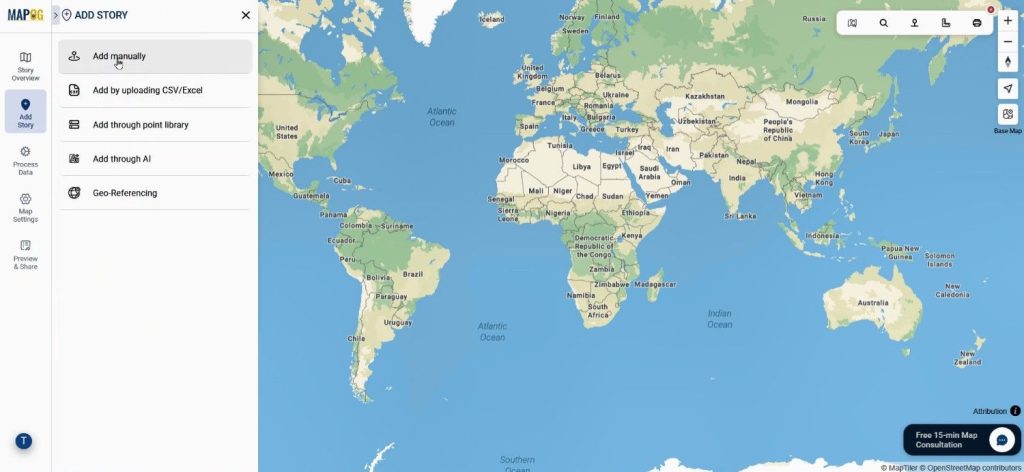
The process of Creating 3D Building Maps begins with starting a new category story in MAPOG. Once, the base map is ready, use the Add Manually feature from Add Story to input your real estate data. This ensures every building or block can be precisely represented with its attributes.
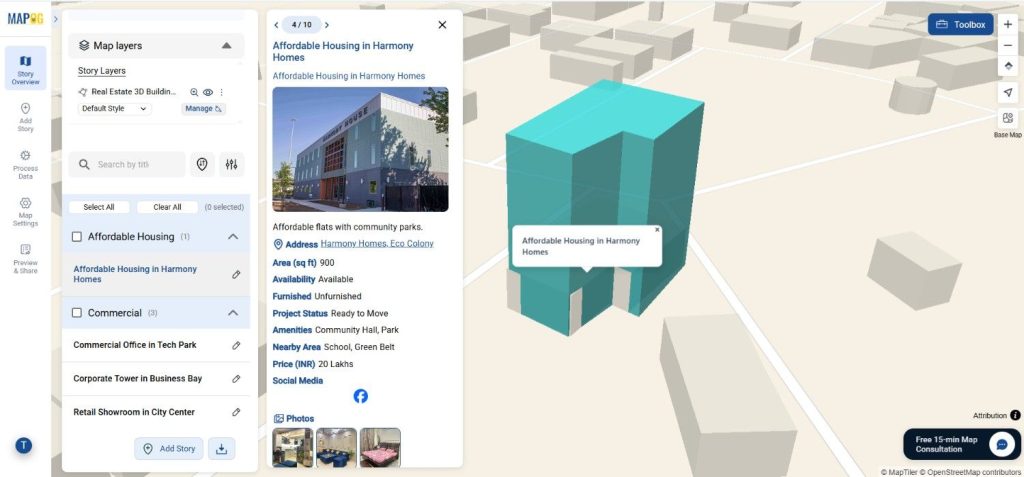
Step 2: Defining Categories & Feature Type
Next, create categories such as “Residential” or “Commercial” using select category settings icon.
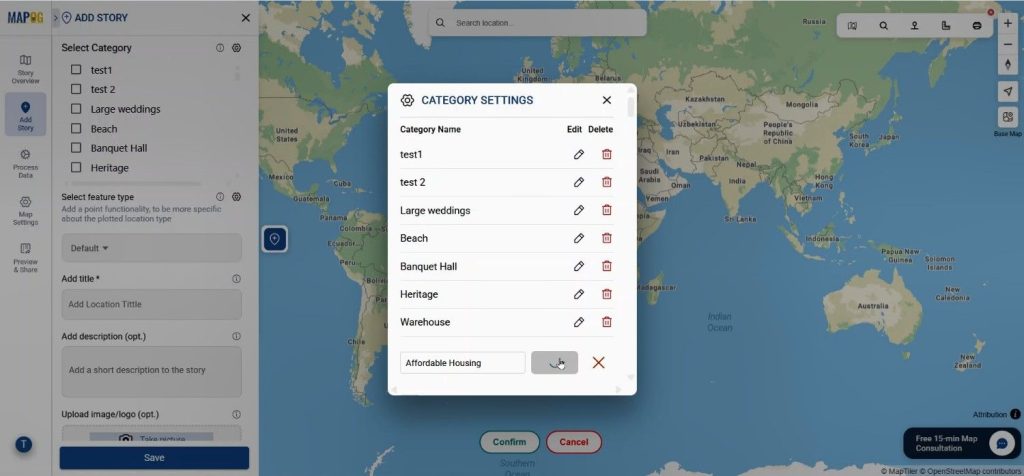
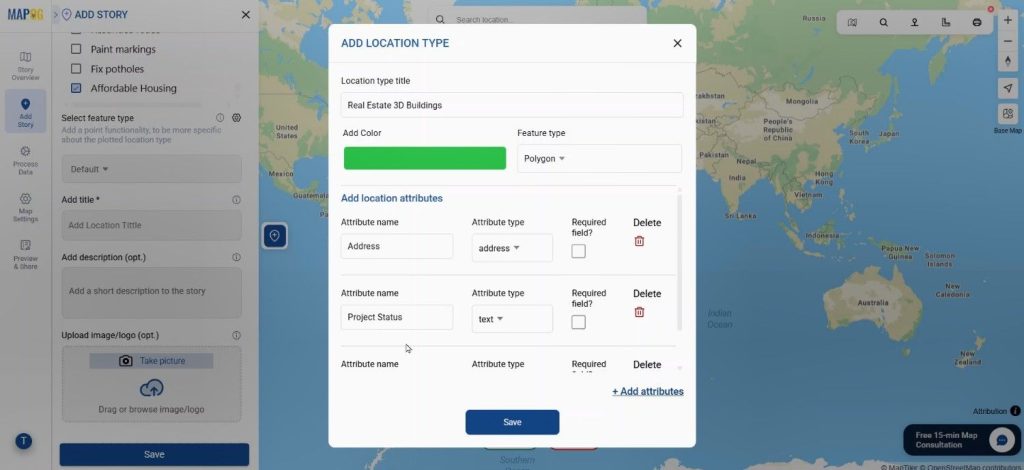
Then, come select feature type settings icon & define a feature type named “Real Estate 3D Building” and select polygon since buildings occupy defined areas. Include different kinds of attributes that describe the building perfectly.
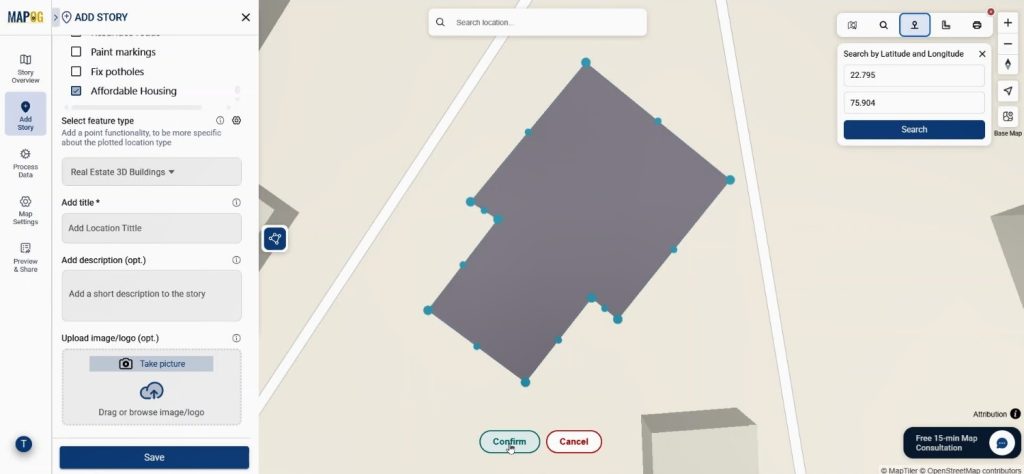
Step 3: Mapping with Polygon Tracing
Now provide buildings latitude and longitude using the toolbox, and your building location will come on map.
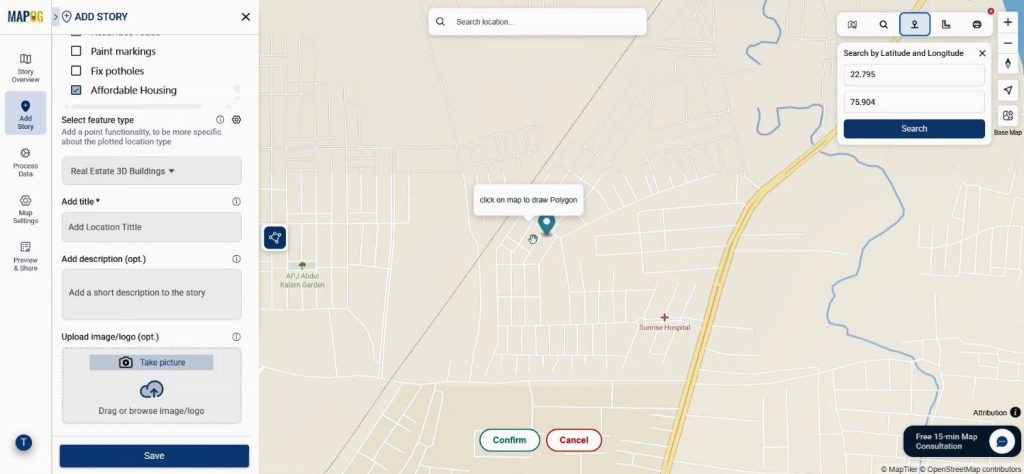
and use polygon icon for tracing to outline the building footprint. By clicking around the site’s corners, you create a closed area for each building. Then conform it.
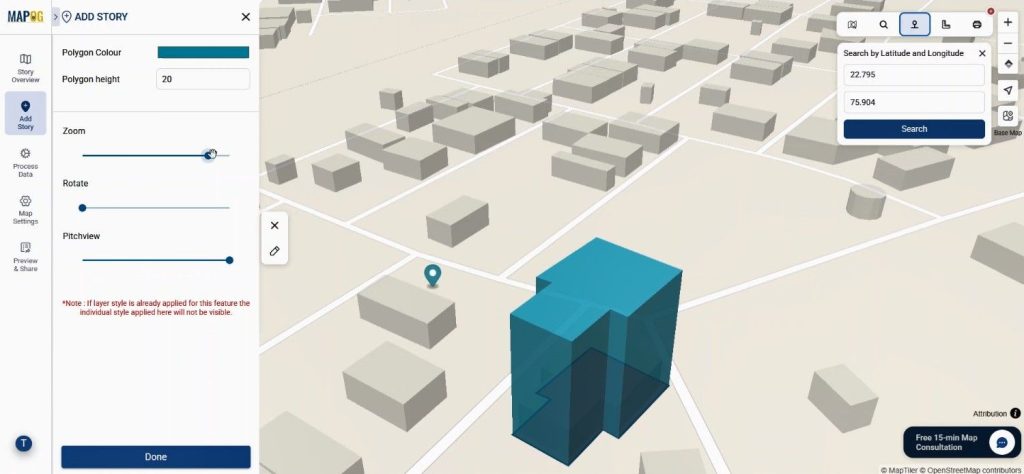
Step 4: Applying Style Customization
This is where Style Customization comes in. Click on the pencil icon & assign colors, adjust building height, set the rotation, and apply pitch for the 3D perspective. So, this makes the project map visually intuitive for clients.
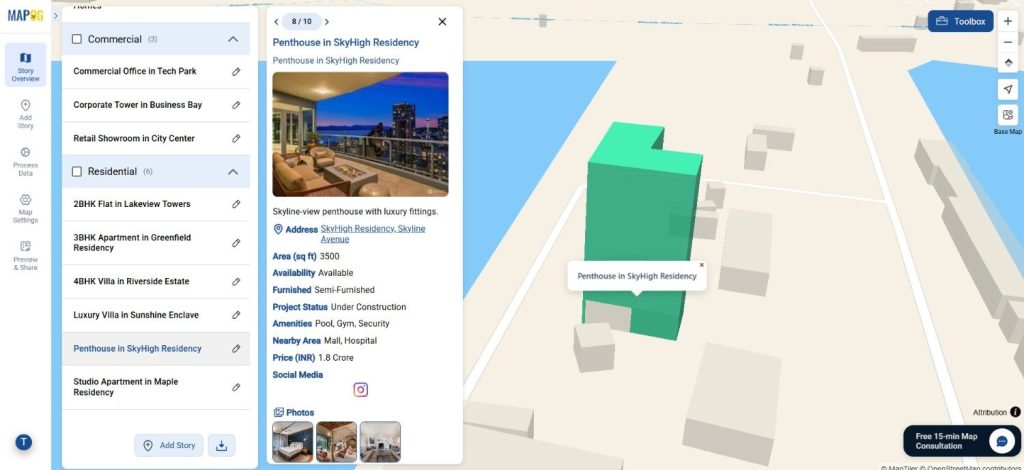
Step 6: Adding Attributes & Saving
Finally, input details such as address, price, status, description, and images. Save the section.
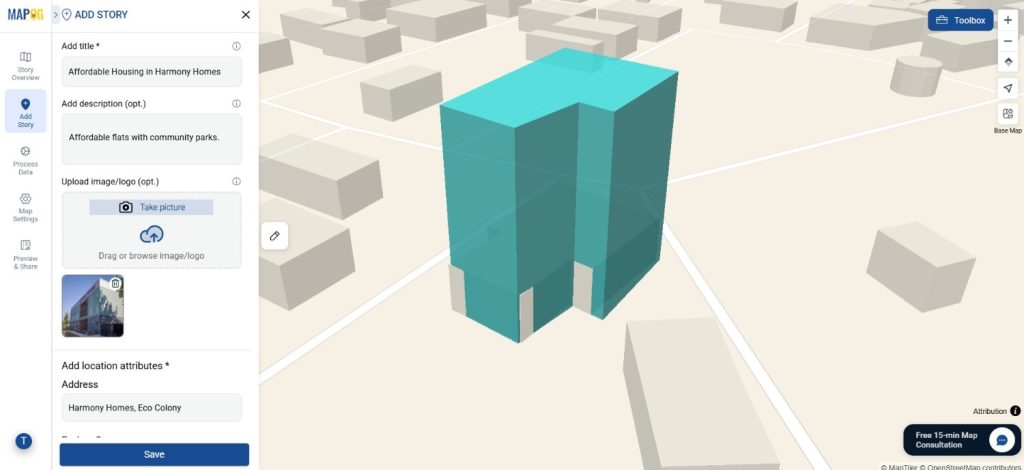
Repeat the process for all buildings in the project. In the end, you will have a full 3D interactive real estate project map ready to showcase.
Industry Relevance & Benefits
In real estate, competition is high, and clients want clarity before making decisions. By Creating 3D Building Maps, you make complex data accessible and visually appealing. It improves client trust, enhances presentations, and speeds up sales. For instance, instead of flipping through brochures, clients can click on a building, view available floors, and instantly see its furnishing status. This adds transparency and builds confidence in the project.
Conclusion
Creating 3D Building Maps is no longer just a technical exercise—it’s a communication tool. With platforms like MAPOG, real estate developers can use Add Manually for precision and Style Customization for realism, making their projects far more interactive and understandable. Whether you’re building residential towers or commercial spaces, bringing them to life on a 3D map can redefine how clients engage with your projects. Explore how 3D maps can enhance your workflow today.
Do you want to see the step-by-step process to create such 3D interactive map?