When managing urban infrastructure projects, uploading data to a map is only the beginning. The real value emerges when teams can edit and update point information after uploading data seamlessly. For example, a fire safety company that installs alarms every month needs to keep its records accurate and current. While uploading installation data offers an initial overview, continuous updates ensure accuracy over time. Similarly, a tourism company can also keep updating its data to reflect new sites, services, or seasonal changes.
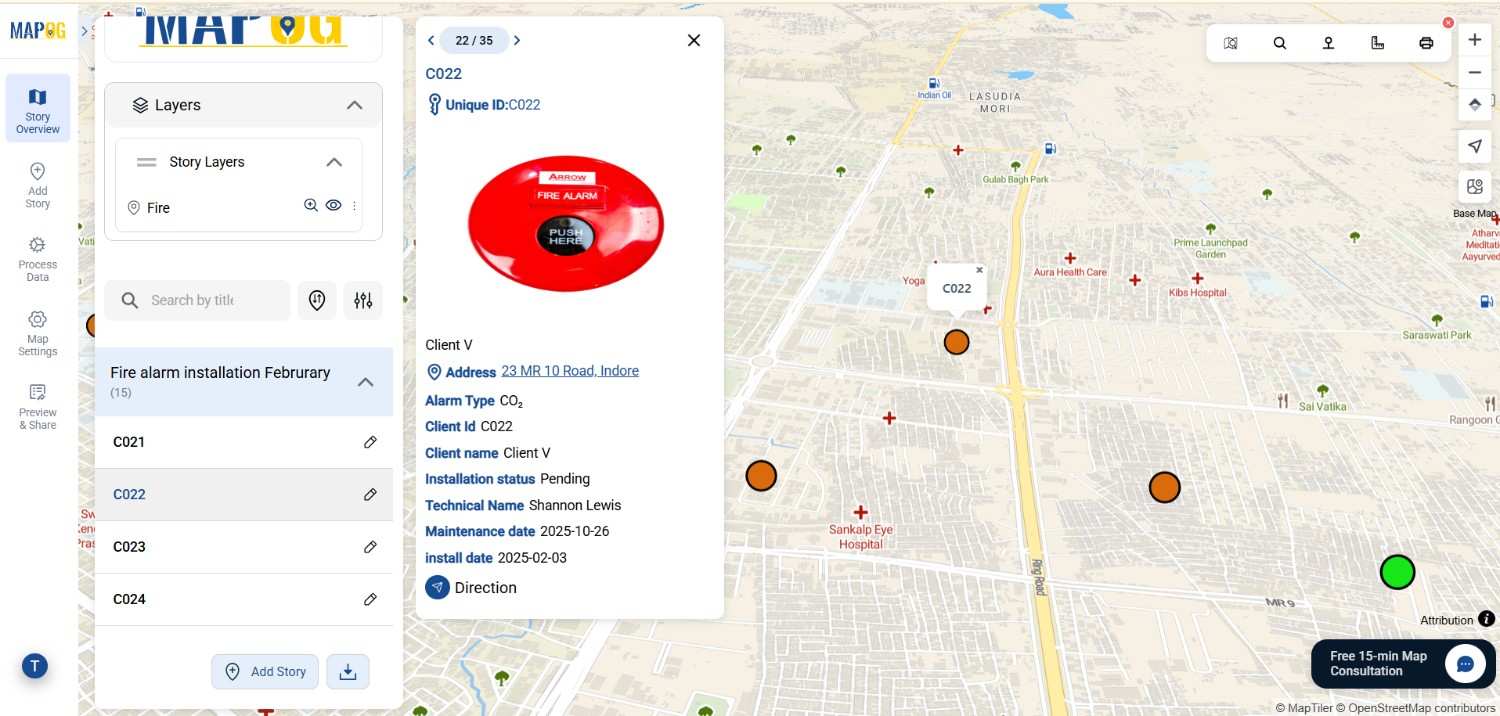
With MAPOG, users can not only upload client site details but also modify attributes such as client name, address, installation date, alarm type, history , or technician details whenever necessary. Consequently, organisations maintain reliable records and avoid duplication or outdated entries.
Key Benefits of Edit and Update Point information after Uploading Data
- Coverage Tracking: Updated points highlight which areas already have installations and where additional coverage is required.
- Transparency: By editing status fields (working, pending, or under maintenance), both clients and managers remain informed in real time.
- Client Engagement: Sharing interactive maps with the latest updates showcases completed projects and strengthens trust.
- Planning and Monitoring: Regular updates help schedule technician visits of electric stations , plan maintenance, and optimize resources efficiently.
Step-by-Step Guide for Edit and Update Point information after Uploading Data of Fire Alarm Installation Map
updating a map is simple. Instead of starting from scratch, you can keep adding new information directly into the same map. By uploading updated excel file .
Open the Existing Map
First, log in MAPOG and open the map you already created with January’s installation data from all map/story section. Instead of creating a new project, simply enhance the existing one.
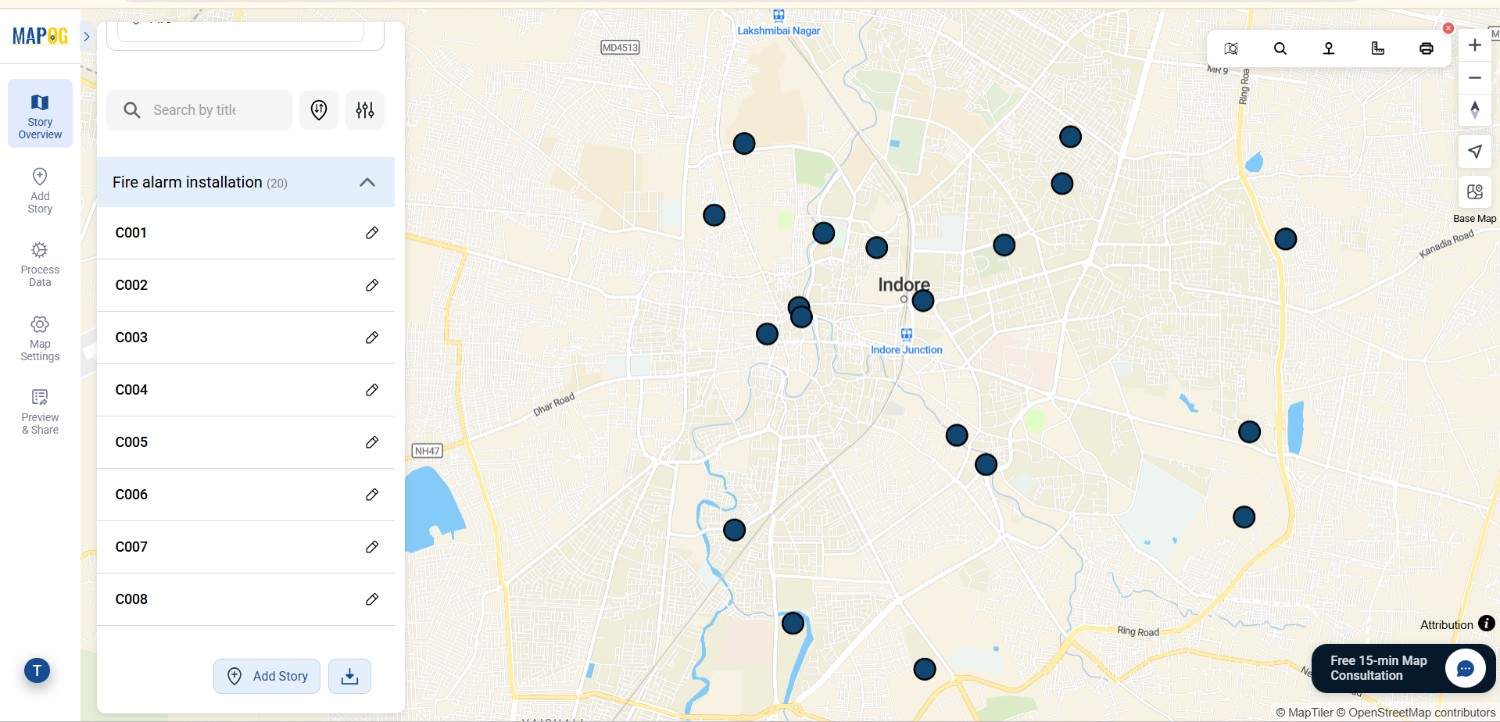
Upload the New Excel File
Next, prepare your February Excel file with client names, addresses, installation dates, alarm types, and coordinates in same existing file. Go to Add Story> Add by Uploading CSV/Excel. Browse & upload the file.
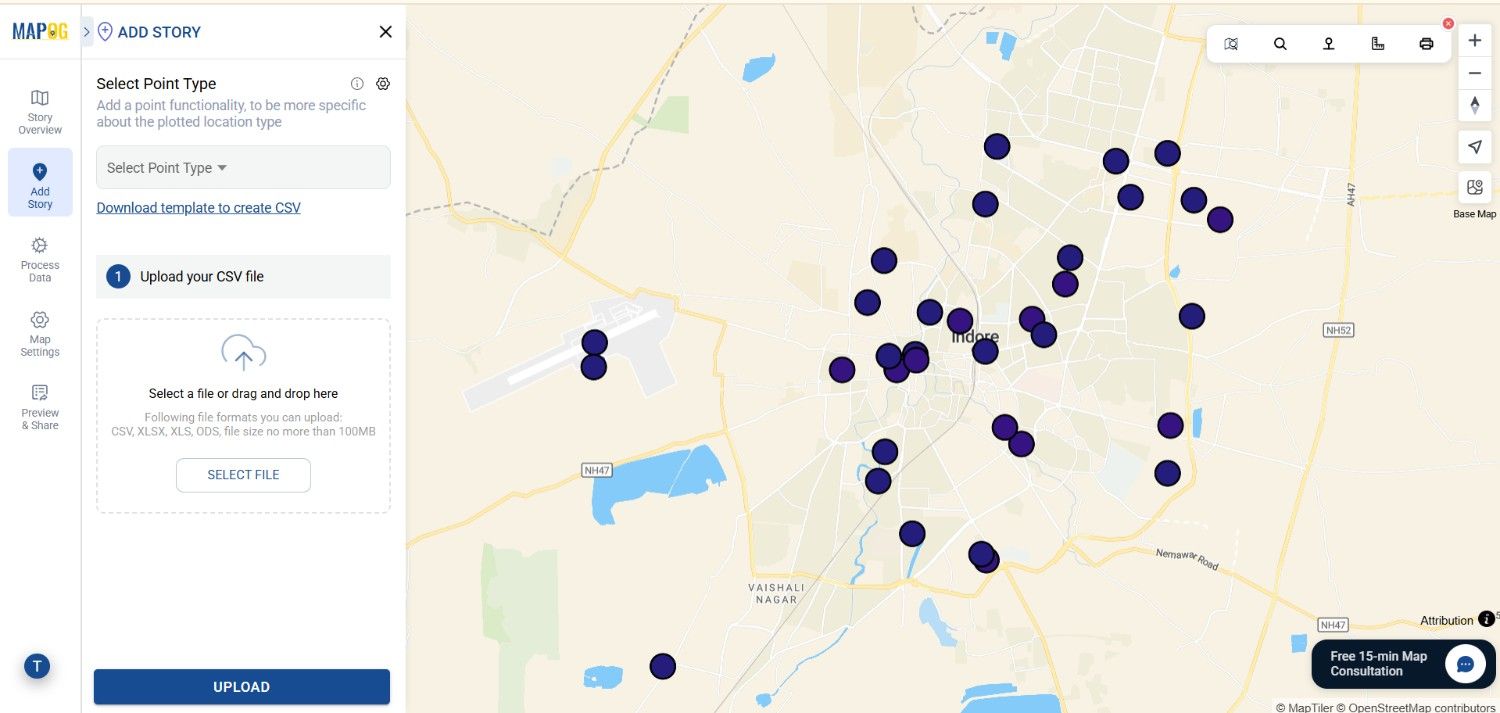
Define Attributes
Go to select Point Type Settings, create a new location management type. Provide title, icon & feature type (point) to that. Add attributes like client name , address , status etc to make your map informative and actionable. Lastly save the location type.
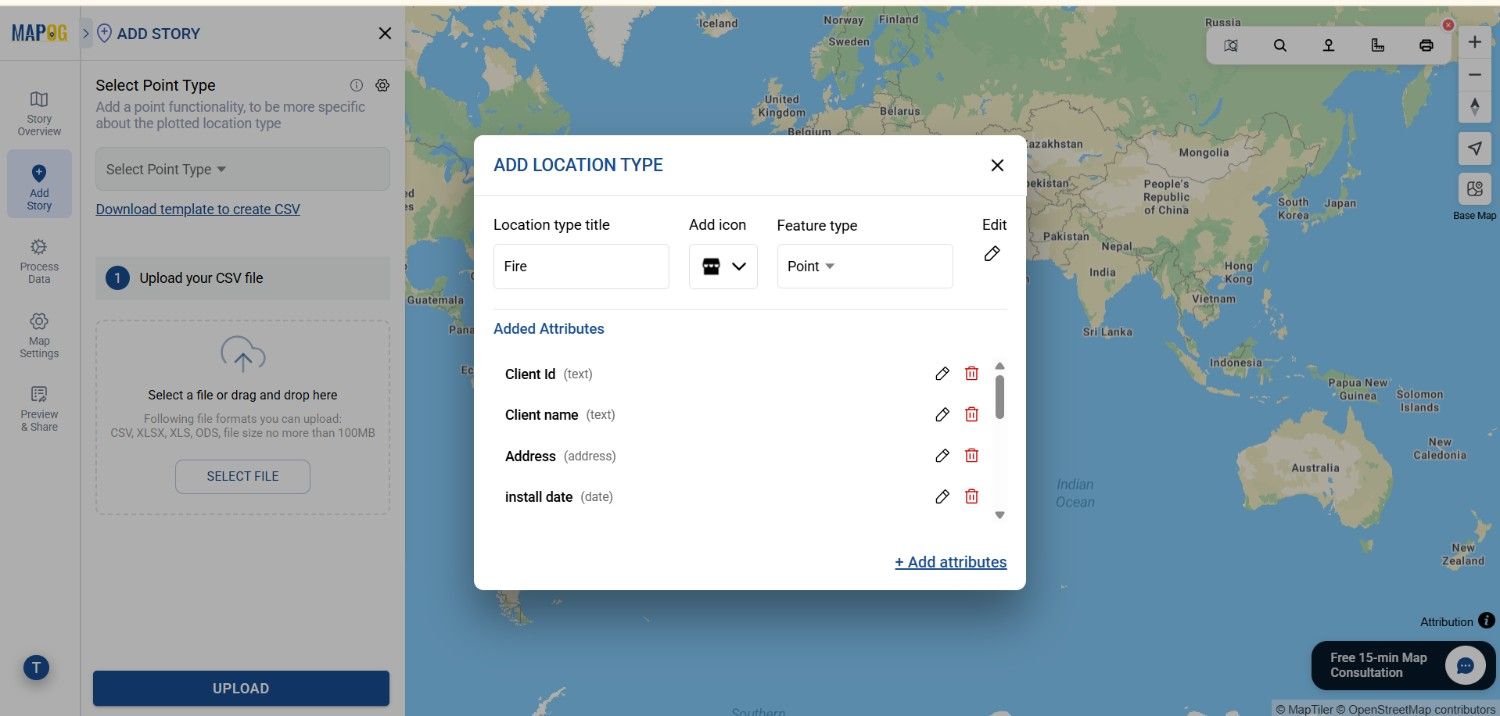
Next, select the location type we created from drop down & upload the file.
Delete Duplicate Points
Now move to the Match Excel Option and select your unique ID. While uploading or updating, there are several handling features such as auto-generating IDs or updating existing ones. Importantly, it also provides the Ignore Duplicate Points option. This function automatically identifies repeated entries—points with the same coordinates and attributes—and removes extras. Once matched, align all attributes along with coordinates with the Excel columns and submit.
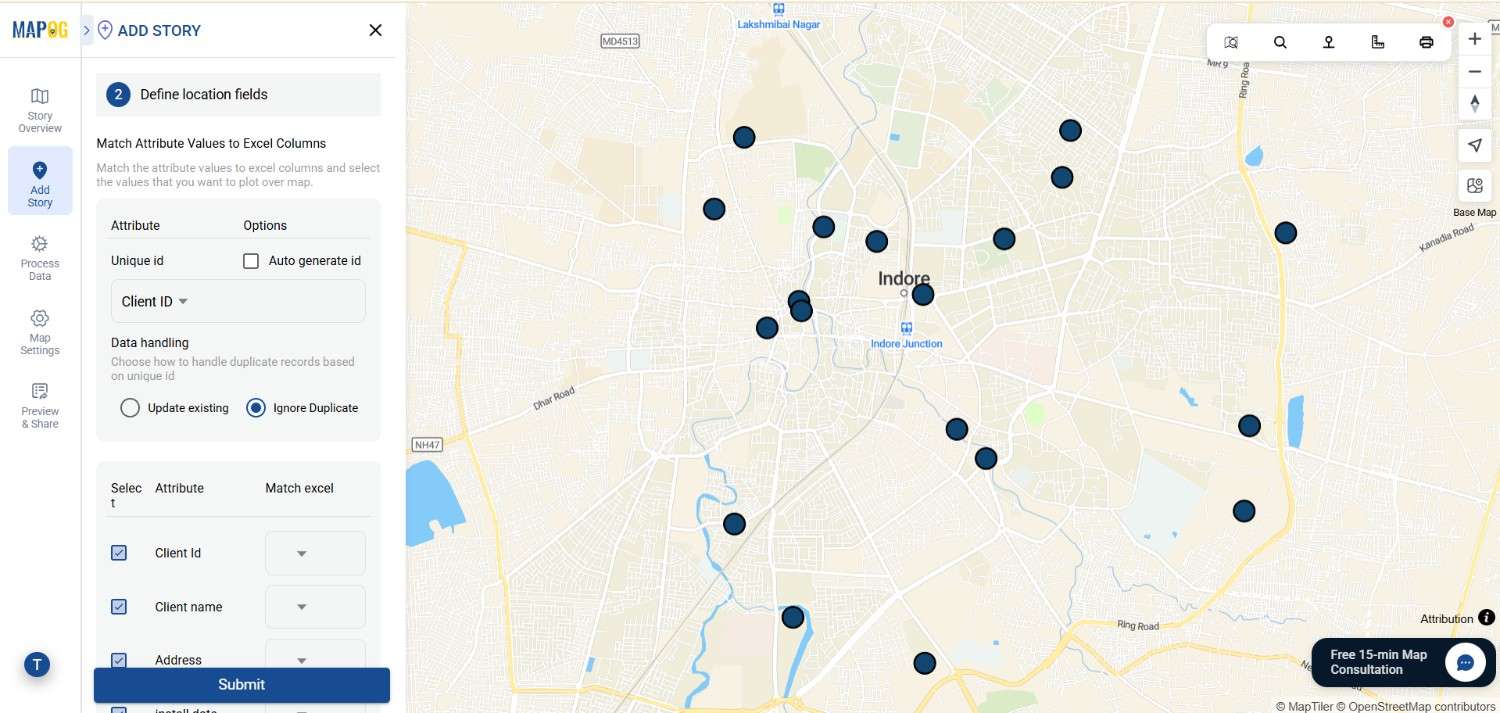
Upload the data
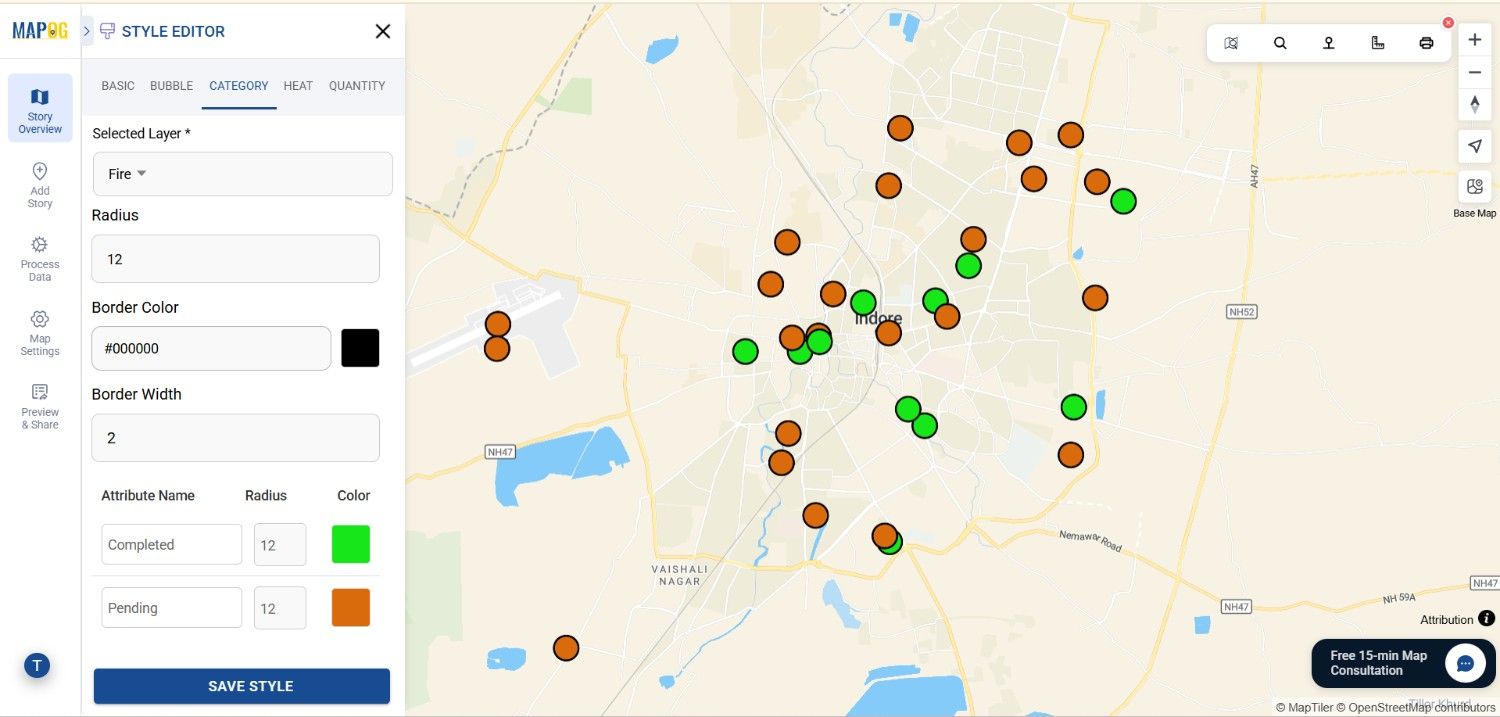
After uploading the February data to the same map, the next step is to style the updated layer. Go to Story Layers > Style Layer and apply clear visual categories. For example, mark green for completed installations, orange for pending sites. Finally, attach the styled output image to demonstrate the updated and organized dataset.
Industry and Domain
When shared widely, these maps transform how businesses manage safety infrastructure. Fire safety companies, for instance, can demonstrate reliability to clients, while managers track progress in real time. Additionally, technicians can plan maintenance schedules more effectively by relying on updated, accurate data.
By deleting duplicates, businesses keep their maps clean, interpretable, and free from redundancy. For example, if a client location is accidentally uploaded multiple times with identical details, feature ensures only one record is kept. Therefore, storage is saved, coverage tracking improves, and long-term maintenance planning becomes more efficient.
Conclusion
Mapping fire alarm installations is more than just a technical exercise—it is a proactive step toward building safer and smarter cities. With MAPOG, fire safety companies can create interactive maps that track installations, improve transparency, and strengthen client trust. Above all, continuous updates guarantee that no neighbourhood is left unprotected.
Exploring Our Previous Blogs
- Role of GIS In Irrigation Planning and Water Resource Management
- How GIS and Smart Mapping Reduce Urban Heat Islands
- GIS in Infrastructure Development and Road Network Analysis
- Flood Risk Mapping with Interactive Web Maps: SaaS Approach
- Optimizing Warehouse Location Selection with GIS for Supply Chain Efficiency