Indeed Access to safe drinking water is firstly a basic human right, however many underserved neighborhoods for instance still face challenges in finding electric stations and clean water sources. Thus how to map Water ATMs and community taps using MAPOG provides a comparable data-driven solution in like manner to visualize access gaps and plan interventions. In addition to by combining location data over with attributes like water quality, cost, and timings, to understand beyond its history, as a result decision-makers, can work together for better water equity comparable.
Why how to Map Water ATMs and community taps Matters
Water ATMs and public taps are often installed to serve communities with limited access to piped water along with water availability near tourism . However, without proper data visualization, some areas may end up over-served .
How to Map Water ATMs and community taps benefits include:
- Equity and Access: It is essential to identify underserved areas so new ATMs or taps can be installed where they are most needed. Mapping these gaps helps planners ensure equitable distribution and improve community well-being.
- Transparency: Transparency allows users to track functionality and status—whether facilities are working, under maintenance, or out of service. Citizens and authorities can respond quickly to service issues.
- Community Engagement: Community engagement becomes stronger when citizens locate nearby facilities in real time. They save time, reduce frustration, and make better decisions about where to access clean water.
- Planning and Monitoring: Effective planning and monitoring are supported as governments and NGOs allocate resources efficiently and schedule timely maintenance. Long-term sustainability and service reliability are improved.
Step-by-Step Guide: Creating a Water ATM Map Using GIS
Step 1: Prepare Your Data
collect information about each Water ATM and community tap.
- Location Name
- Type (Water ATM, Hand Pump, Community Tap)
- Address & City
- Water Quality (TDS)
- Timings
- Status (Working, Not Working, Under Repair)
- Latitude & Longitude
- Underserved Neighbourhood (Yes/No)
- Maintenance Frequency
Step 2: Create a New Map Story
Log in on MAPOG and click Create New Map. Choose a category map template, give it a title like “Water ATM and Tap Access Map,” and add a short description.
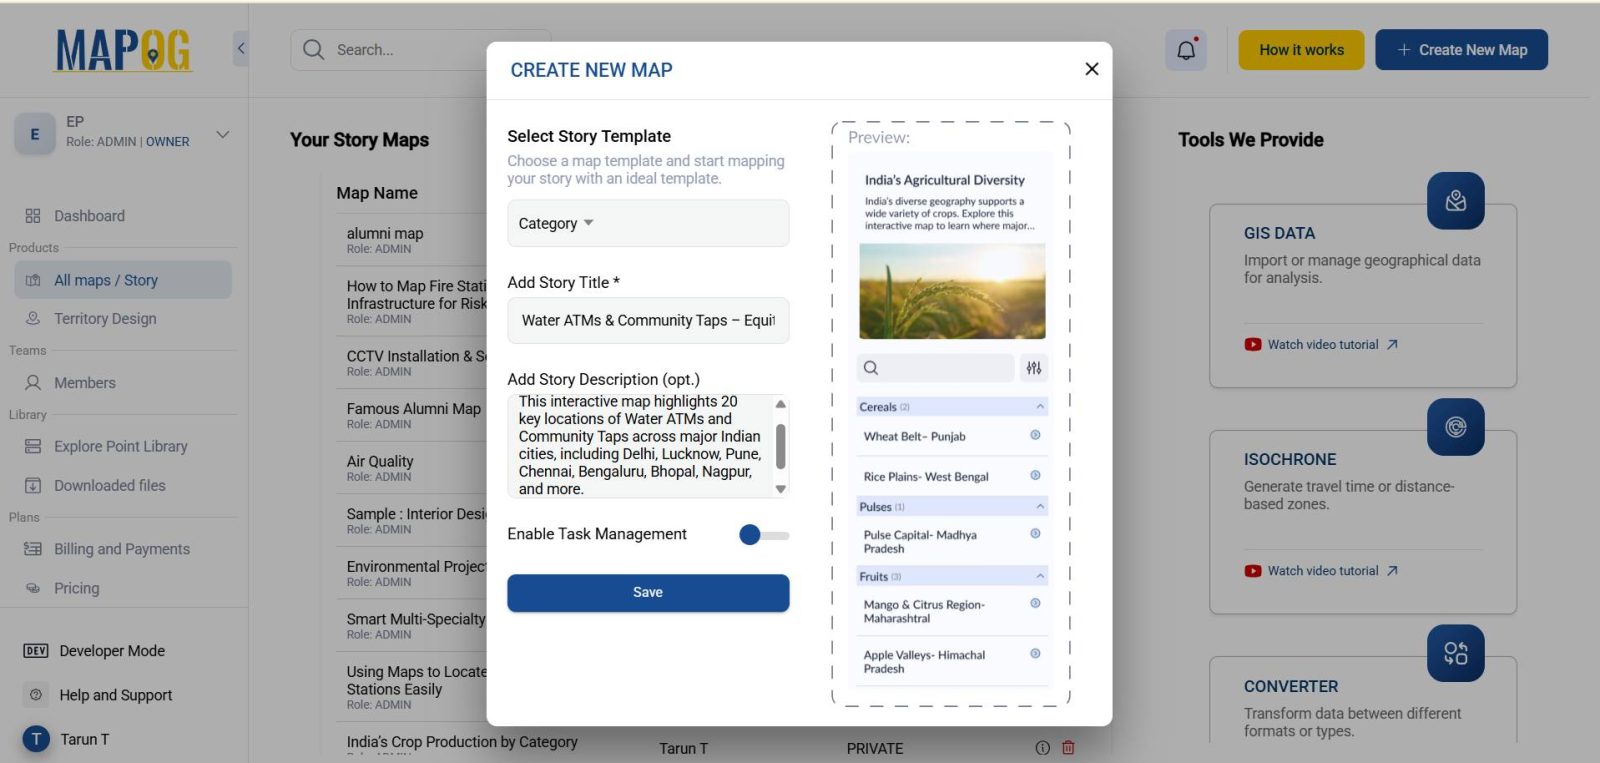
Step 3: Upload Your CSV
Go to Add Story > Add by Uploading CSV/Excel and upload your prepared dataset. Ensure that latitude and longitude columns are correctly matched .
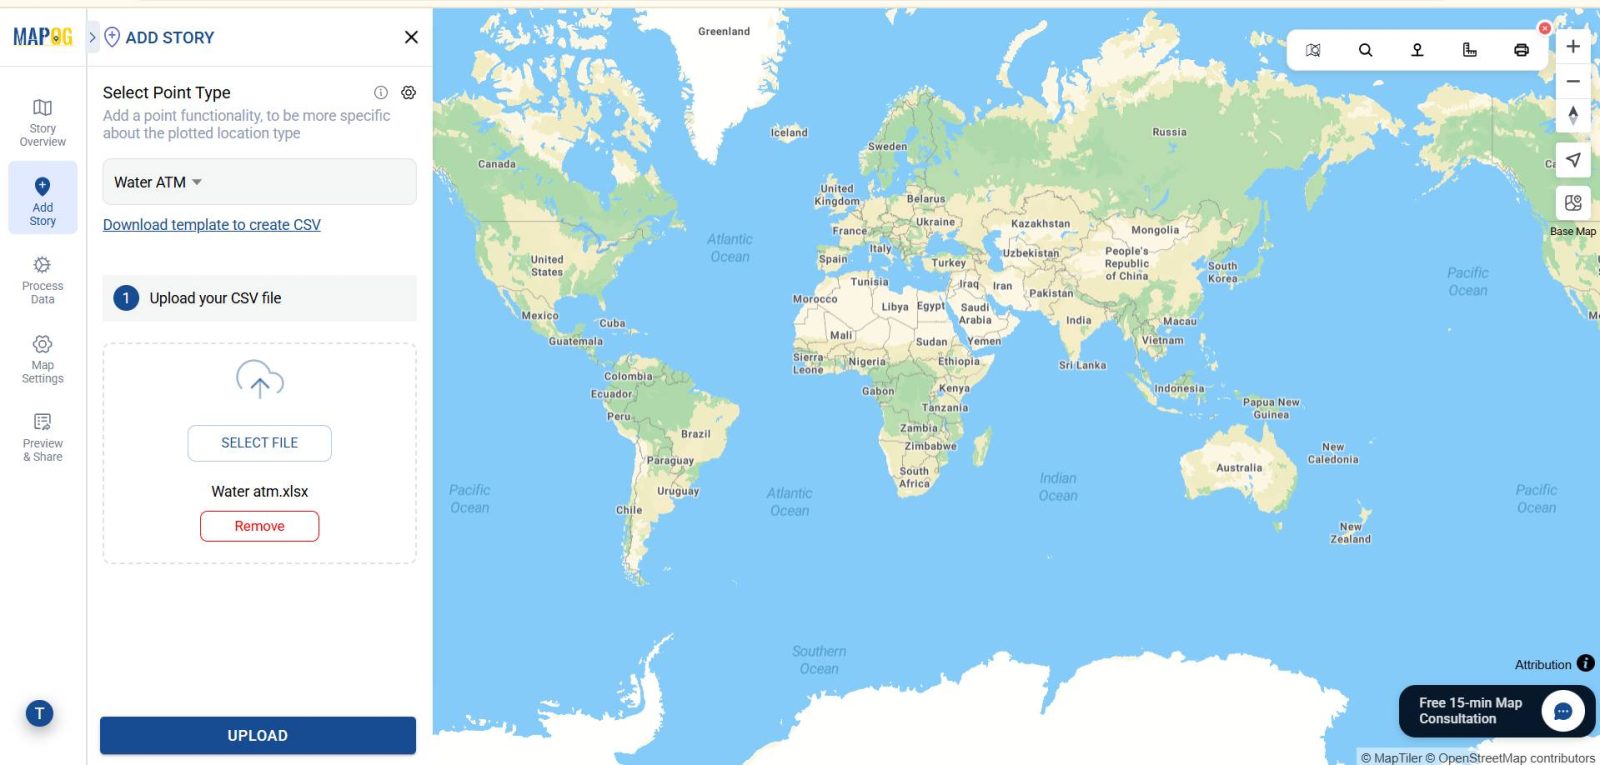
Step 4: Define Attributes
Go to Point Type Settings, create a new location management type called Water Source. Add attributes like water quality, cost, status, and timings to make your map informative and actionable.
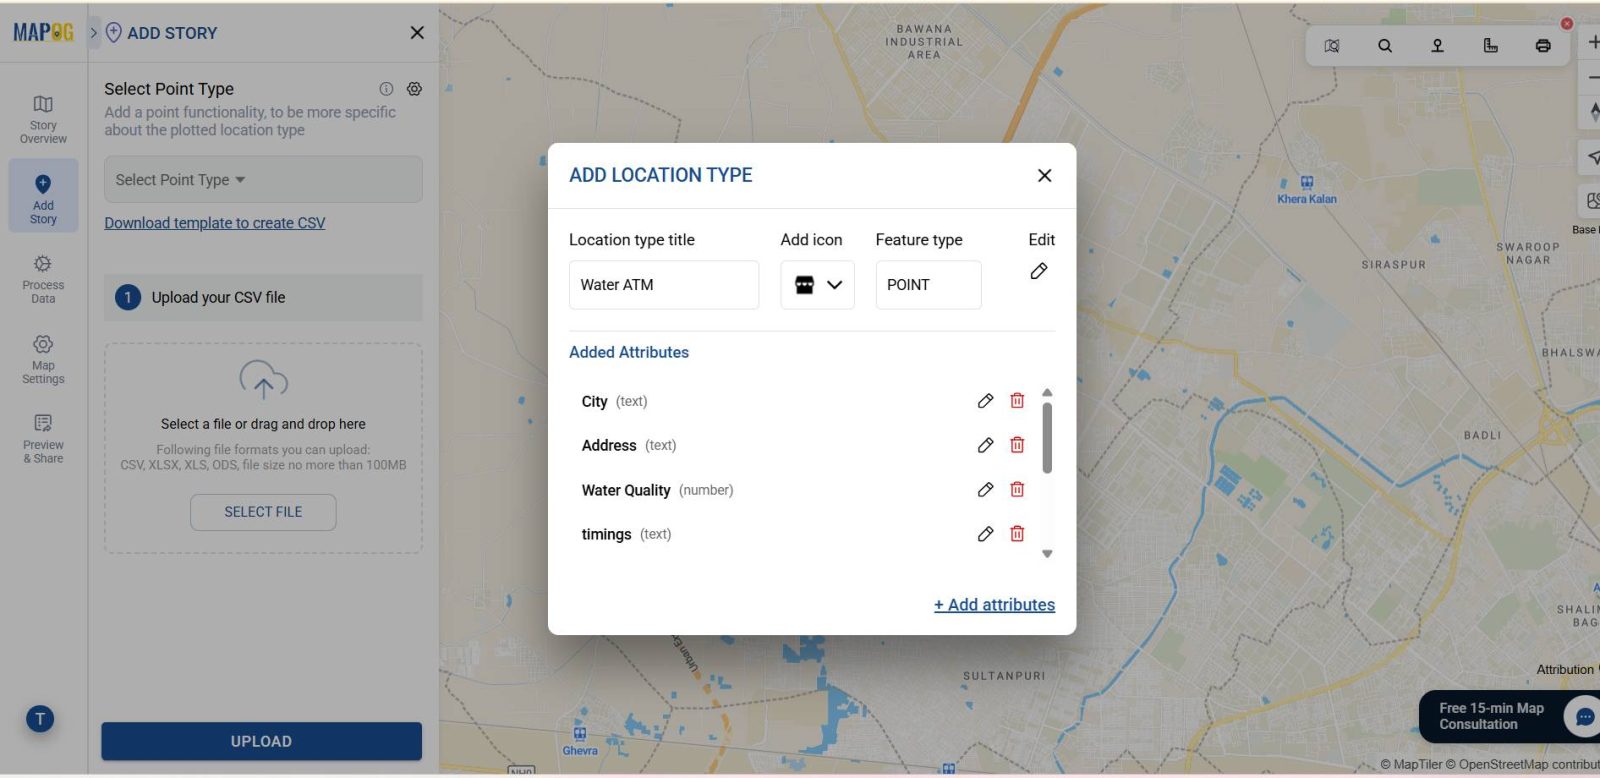
Now match the excel data with the attributes along with latitude and longitude & submit it.
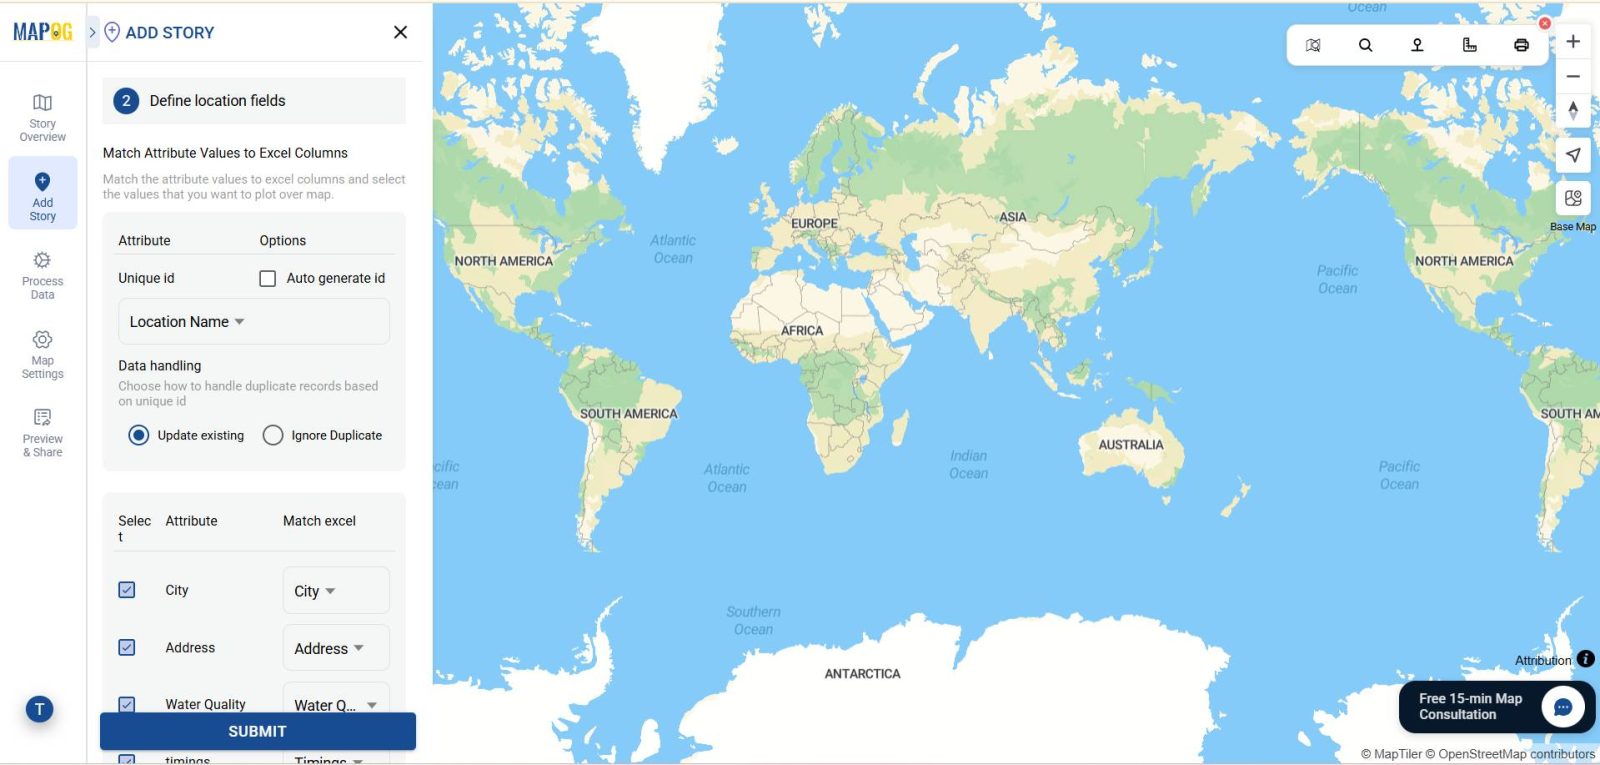
Step 5: Categorize
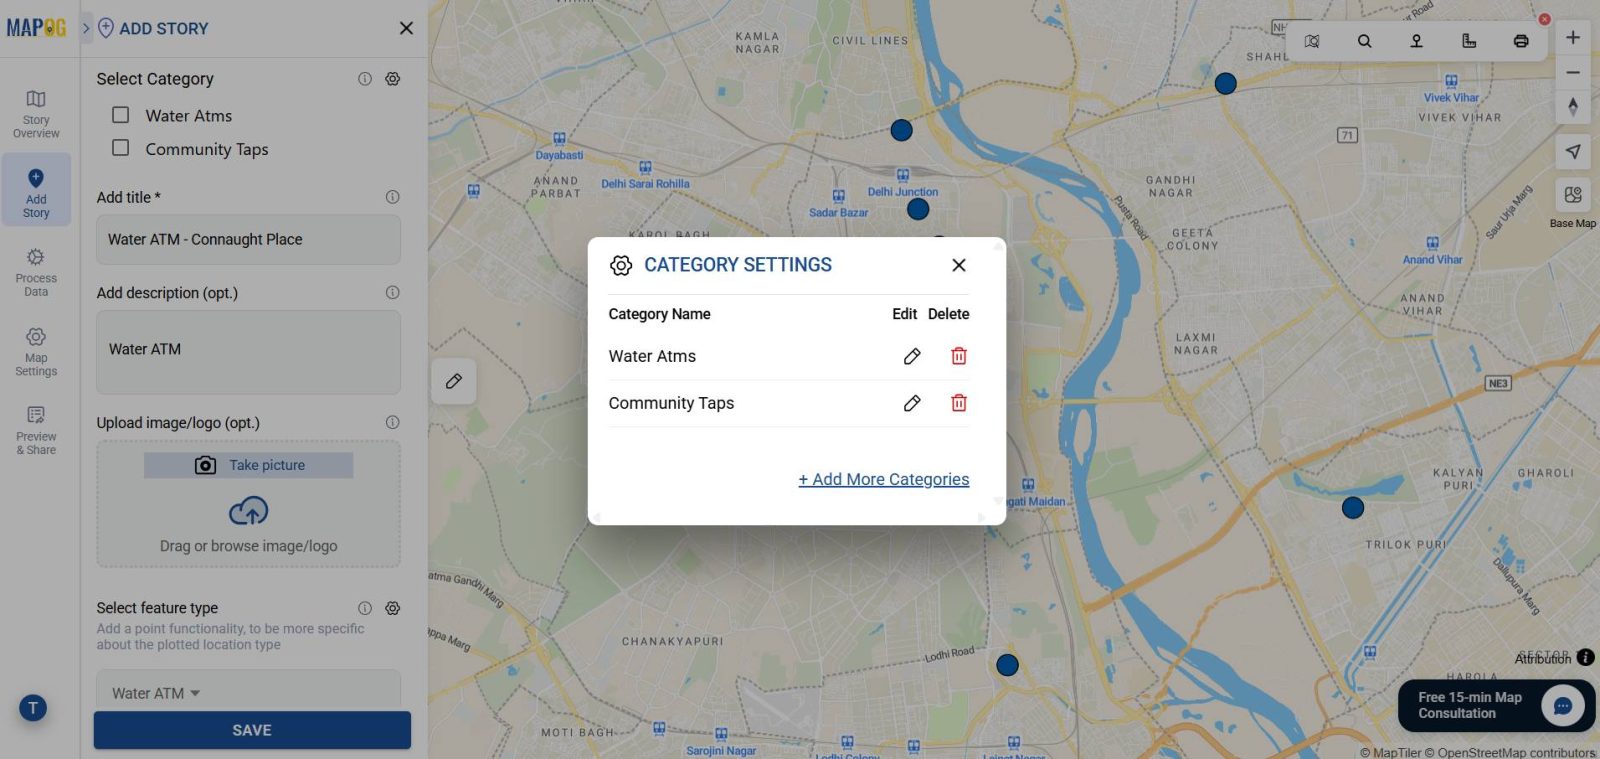
Go to edit point details and on select category settings create new categories like water atms and community tap select one of them which seems suitable and do the same for each point . then upload images & save the point.
Step 6 – Style the layer
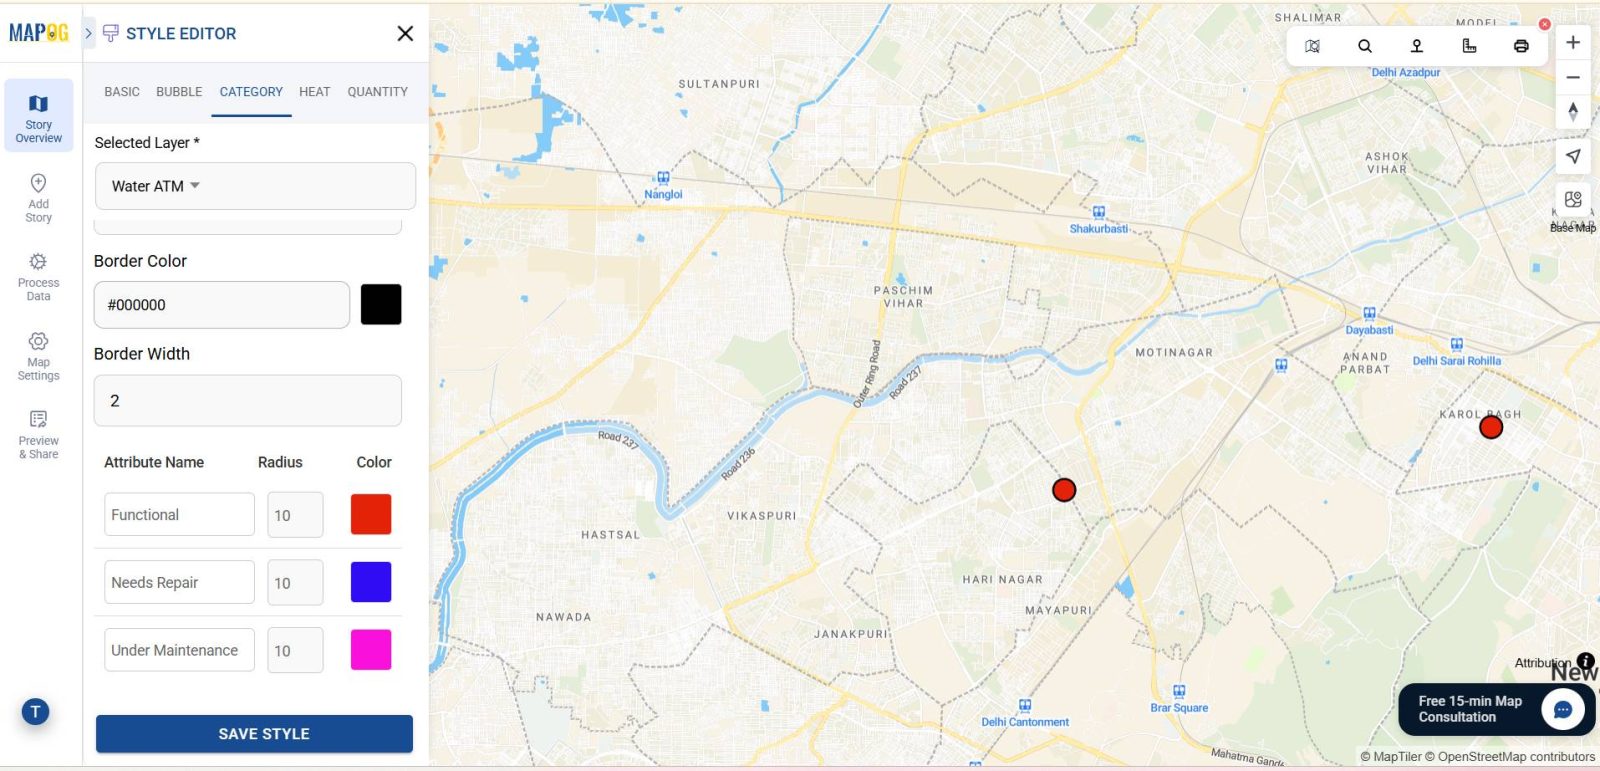
Go to story layers and then style layer then go to category and style the layer by selecting the attribute, Customize icons, colors, and styles to make categories stand out visually .Use color codes or icons — for example, green for functional ATMs and red for non-functional taps — so users can quickly understand availability.
Step 7: Publish & Share
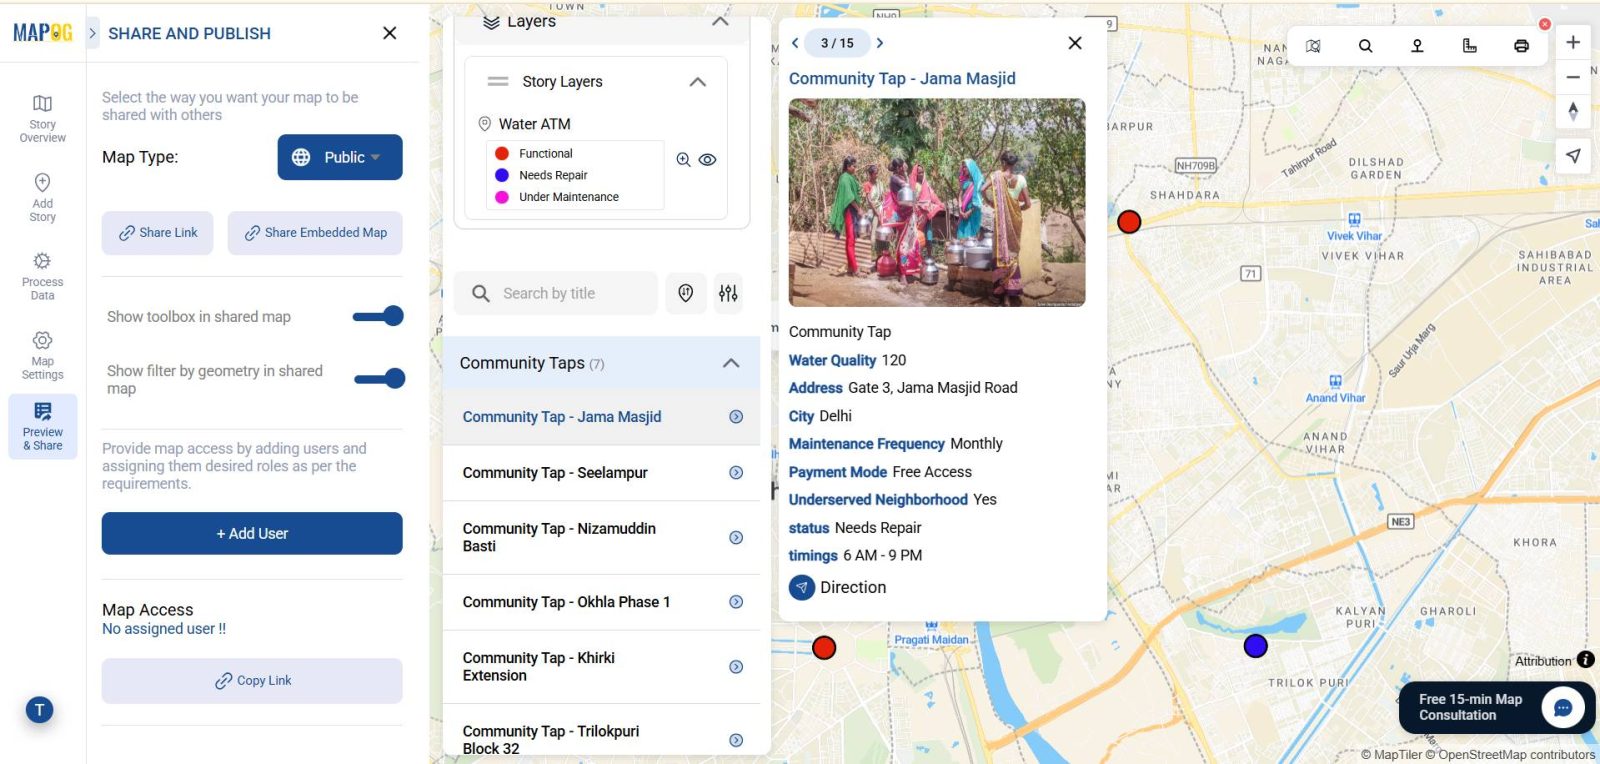
Once your map is ready, click Share & Publish. Make it public for citizens, embed it on community websites, or share the link with local authorities for planning and monitoring.
Industry and Domain
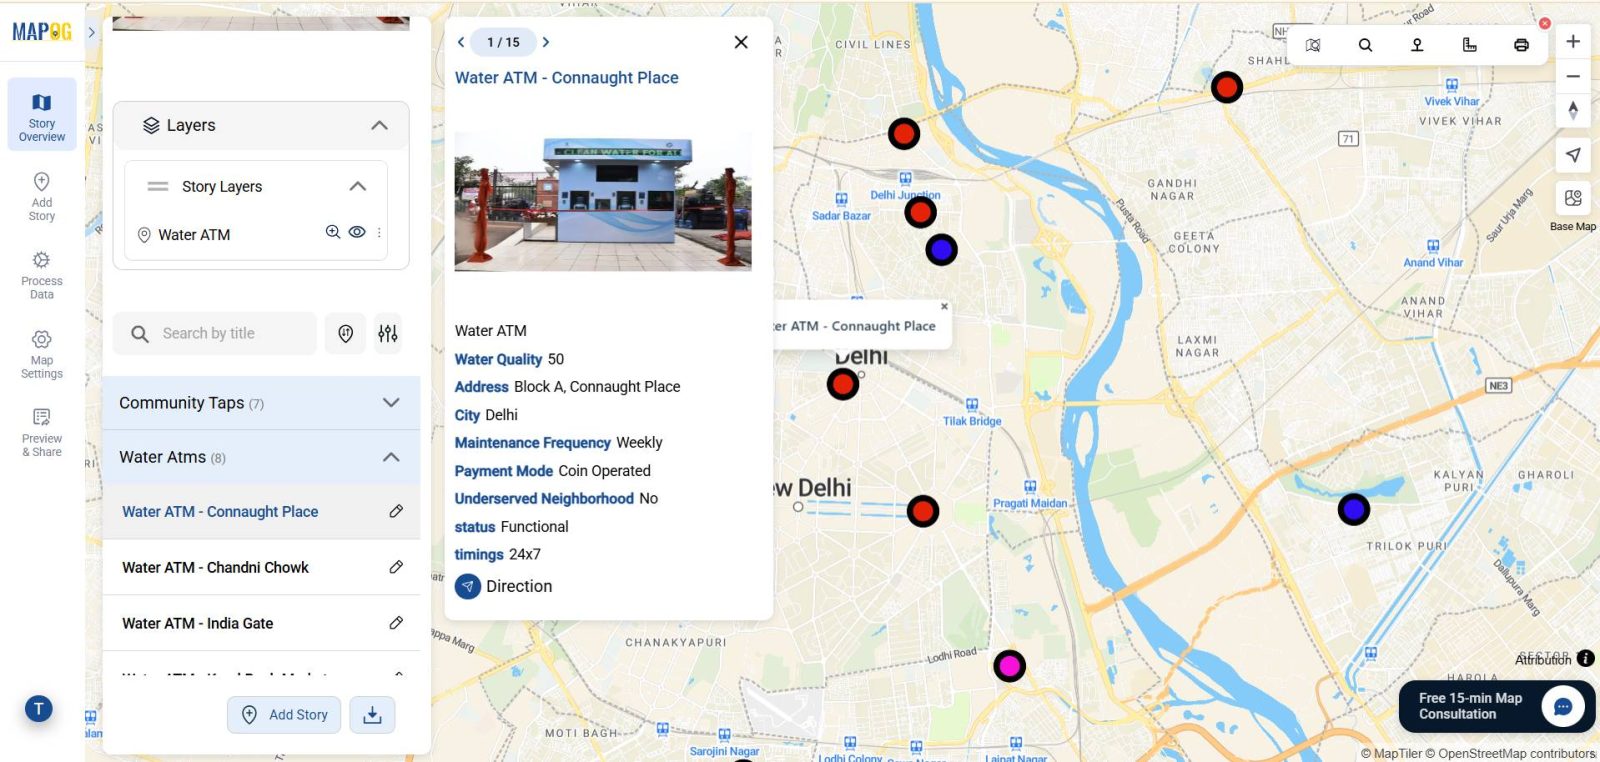
When shared widely, these maps can transform how communities access water. Citizens can quickly locate the nearest functional Water ATM, while policymakers can see service gaps at a glance and take timely action. NGOs can also use the data to prioritize interventions and improve maintenance schedules.
Conclusion
Mapping Water ATMs and community taps is more than a technical exercise — it is a step toward equitable access to clean water. With MAPOG, anyone can create interactive maps that empower citizens, guide planners, and build healthier, more resilient cities.
Exploring Our Previous Blogs
- Role of GIS In Irrigation Planning and Water Resource Management
- How GIS and Smart Mapping Reduce Urban Heat Islands
- GIS in Infrastructure Development and Road Network Analysis
- Flood Risk Mapping with Interactive Web Maps: SaaS Approach
- Optimizing Warehouse Location Selection with GIS for Supply Chain Efficiency