Using GIS for deforestation tracking has become a powerful approach in environmental research. Every year, massive tree cover disappears. Therefore, tracking these changes accurately becomes essential for timely forest conservation efforts. GIS helps researchers and conservationists visualize forest loss clearly and over time. Consequently, it enables faster and smarter decision-making. One of the simplest tools to create such maps is MAPOG. It combines data layering with storytelling in a single, easy-to-use platform. Moreover, it supports anyone—from experts to beginners—in building clear conservation stories.
Key Concept of GIS for Deforestation Tracking
At its core, GIS for deforestation tracking works by comparing forest cover across different years. For example, comparing forest data from 2001 and 2022 highlights the exact areas of loss. As a result, this comparison clearly highlights the areas where vegetation has been lost. Specifically, with MAPOG’s features like “upload vector file” and “advance filter”, users can upload datasets (e.g., forest cover in 2001 and 2022), filter the changes accordingly, and instantly generate a clean visual output that represents the deforested zones.
Step-by-Step Guide to Map GIS for Deforestation Tracking
1. Creating the Forest Conservation Project
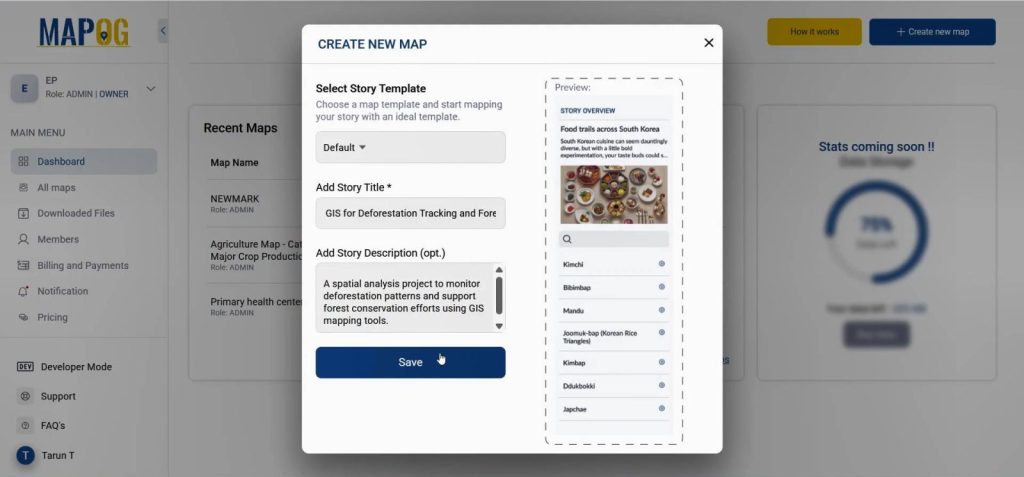
Head over to MAPOG. Click on “Create new map” & add a title, description, and (optionally) an image. Save your setup. Once saved, you’ll be redirected to the map interface.
2. Uploading Forest Cover Data
In the map interface, head to Process Data > Upload Vector Data under add Upload data section, and upload two vector files representing forest cover in 2001 and 2022.
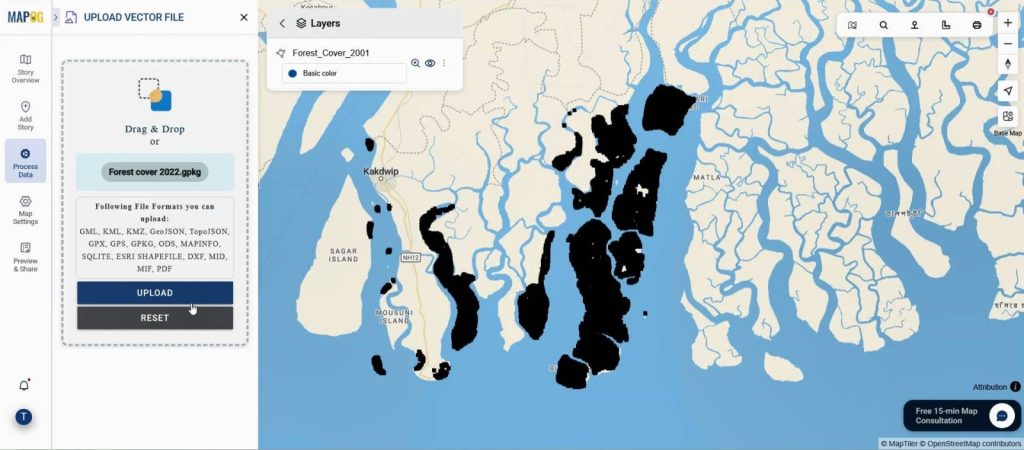
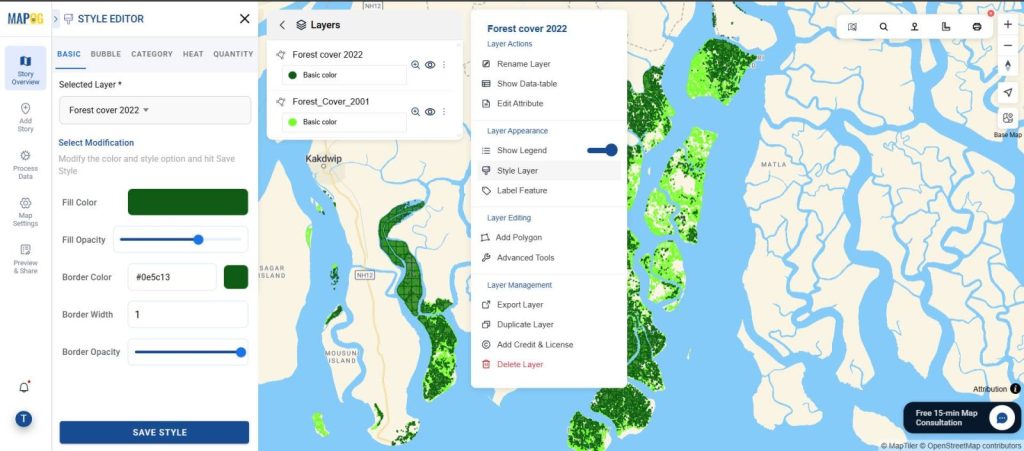
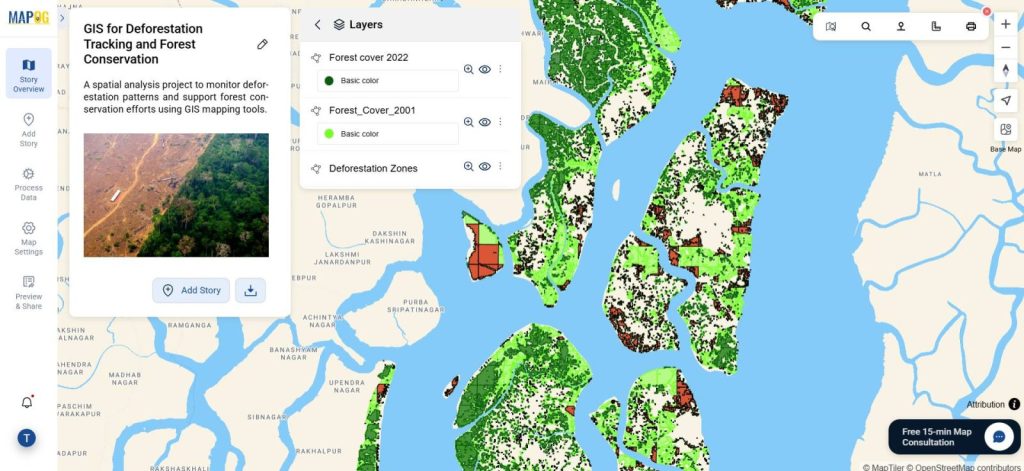
These files can be in formats like Shapefile or Geo-Package. Once uploaded, navigate to Style Layer and assign distinguishable colors—say light green for 2001 and dark green for 2022—so visual comparison becomes easier.
3. Filtering and Identifying Deforested Areas
Now, use the “advance filter” from process data to extract meaningful data. Select the 2001 forest cover layer as your Target Layer Data, and under “Filter by Applying Layer Operations,” choose forest cover 2022 as your Source Layer Data. Select the operation type as “Outside” and hit submit, next click on publish. This will highlight areas where forest existed in 2001 but not in 2022—essentially the deforested zones.
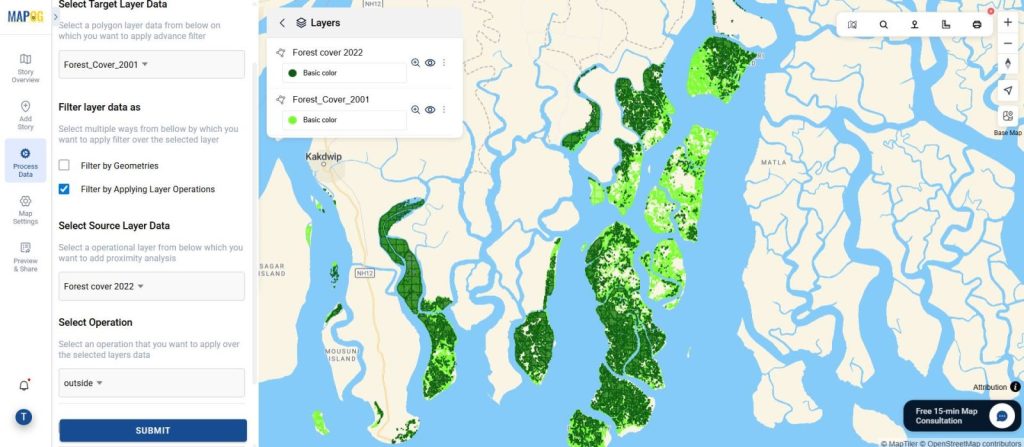
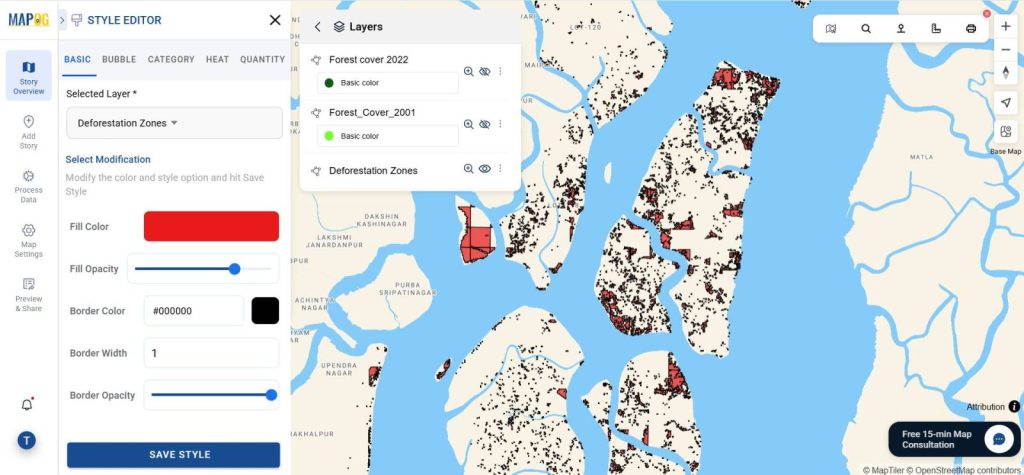
After generating this new filtered layer, rename it to something clear like Deforestation Zones and re-style it using vibrant contrast colors such as bright orange or brown to emphasize loss.
4. Preview and Share
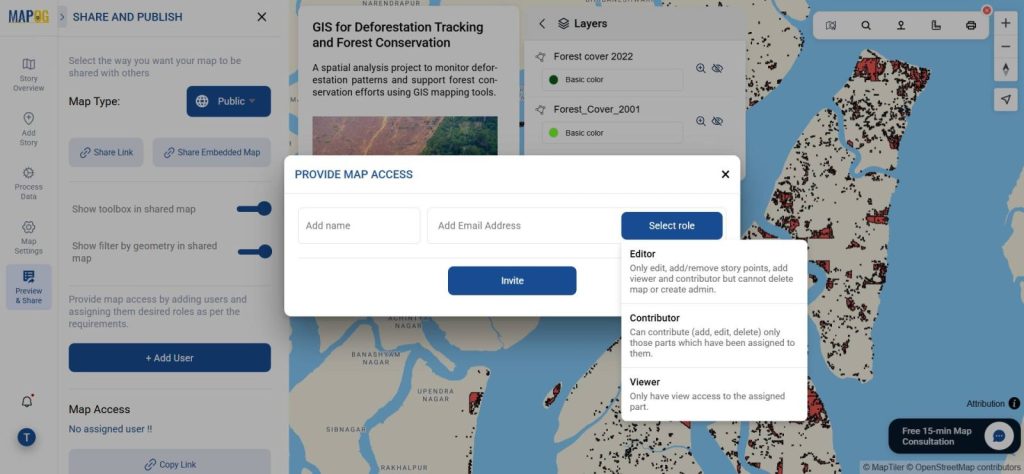
Once your map is ready, use the Preview and Share button to publish it. Make the visibility Public to allow stakeholders, researchers, or the public to view and understand forest loss trends through your map. A direct shareable link will be generated.
Industry Use and Conservation Benefits
Additionally, GIS for Deforestation Tracking has now become a standard tool in environmental monitoring. Not only do NGOs, forest departments, and researchers rely on these visualizations to plan reforestation efforts, but they also use them to propose legal protection or assess biodiversity threats. Furthermore, with MAPOG, even non-specialists can engage in spatial analysis through accessible tools like upload vector file and advance filter, thereby contributing meaningfully to conservation projects. In addition to supporting research, deforestation mapping through GIS also helps governments in several key areas. For instance, it enables the monitoring of illegal logging activities, supports damage assessment after forest fires, and reinforces indigenous land claims by providing transparent, map-based evidenc
Conclusion
Ultimately, the ability to use GIS for Deforestation Tracking empowers not just professionals, but also communities and decision-makers to actively protect and restore our green ecosystems. Therefore, by visualizing what’s been lost, we can better plan what needs urgent protection. And with intuitive tools like advance filter and upload vector file, MAPOG simplifies this entire journey—making conservation storytelling both powerful and accessible.