In today’s fast-evolving urban landscape, identifying the right location for real estate investment is both a science and a strategy. GIS helps in Identifying High-Growth Areas is a go-to approach for investors and planners aiming to make informed, data-backed decisions. From analyzing transportation access to mapping nearby amenities, GIS adds a new level of depth to traditional methods. In one recent project, I used MAPOG to identify high-growth zones with precise spatial layers—and it transformed how I looked at investment areas.
Key Concept: Why GIS for Real Estate Works
GIS helps in Identifying High-Growth Areas enables investors to visualize factors like infrastructure proximity, amenities, and land use patterns through spatial mapping. Instead of relying on guesswork or outdated trends, GIS helps you see the full picture—from traffic corridors to nearby schools, airports, and hospitals.
When MAPOG offers tools like Buffer and Add Story, they simplify what used to be complex. These tools let you define impact zones (like 300 meters around roads) and then plot narrative points with titles, descriptions, and images. This is not just mapping—it’s decision-making powered by data.
Step-by-Step Process: Identifying High-Growth Areas
1. Start a New Map
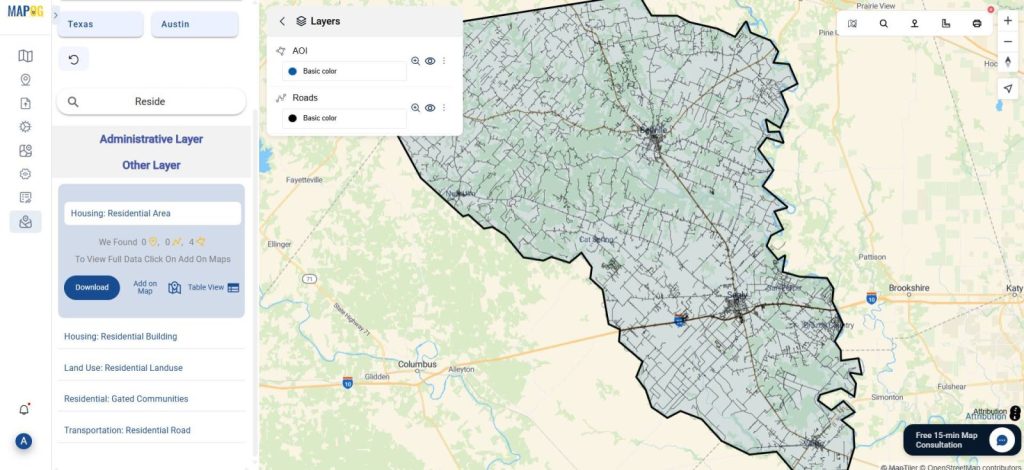
To begin, I visited MAPOG, created a new map, added a name and description, and saved it.

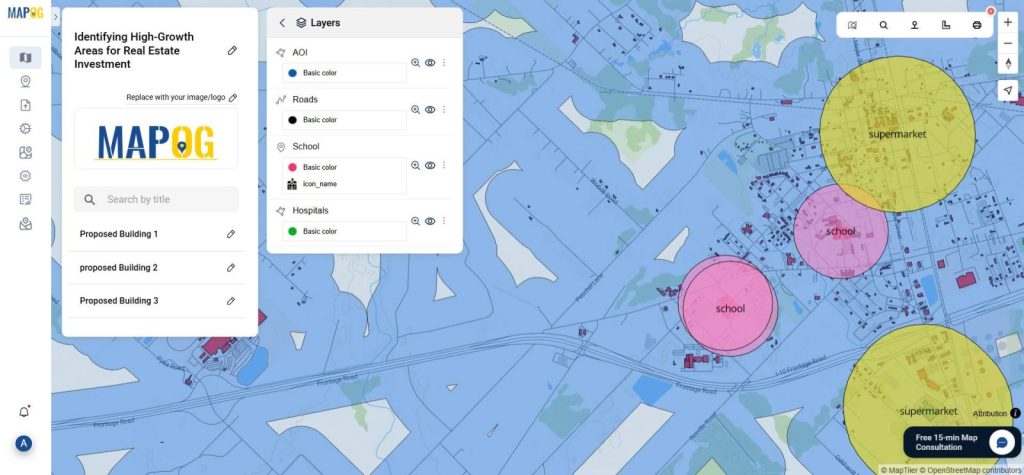
2. Add the Area of Interest and Layers
Next, I selected an area of interest and added GIS data layers including roads, airports, schools, hospitals, shopping malls, and residential buildings from the platform’s built-in GIS data library.
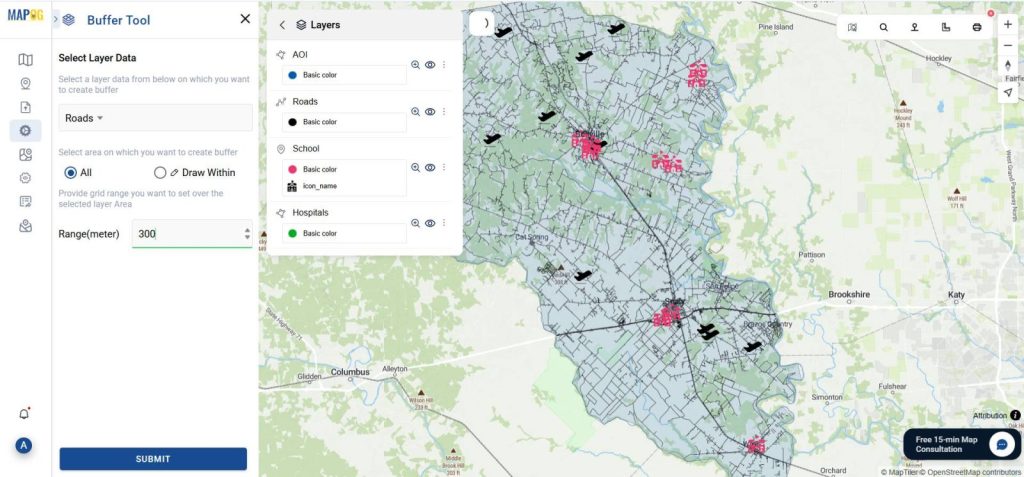
3. Use the Buffer Tool for Precision
This is where GIS for real estate gets powerful. I used the Buffer tool from process data to create specific zones around each asset by providing the specific layer and setting parameter around them:
- 300m around roads
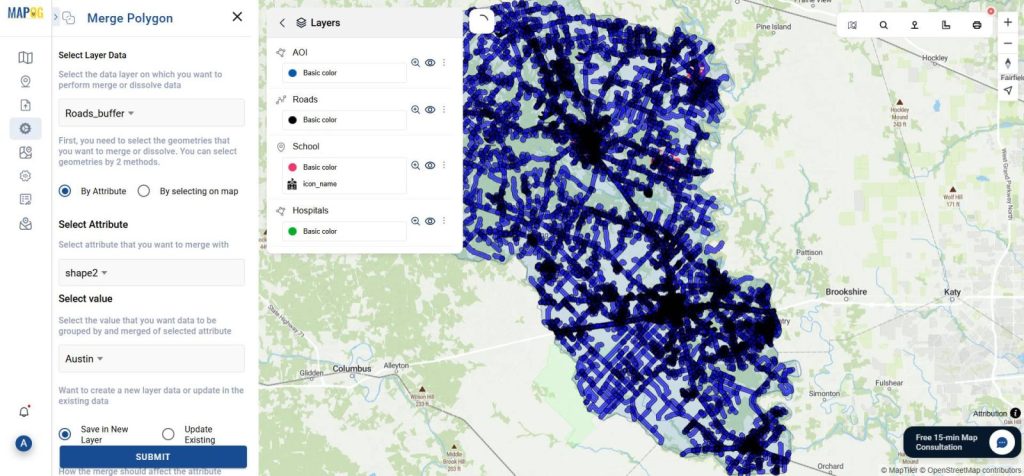
Here, I’ve also merged the buffer for better decision making and visualization purposes. By using the Merge Polygon Tool in process data, I’ve provided the road buffer layer and merged it by attributes and saved it as a new layer.
Next, I’ve created a buffer zone for other amenities in the same manner.
- 500m around schools
- 800m around shopping malls
- 1km around hospitals
- 3km around airports
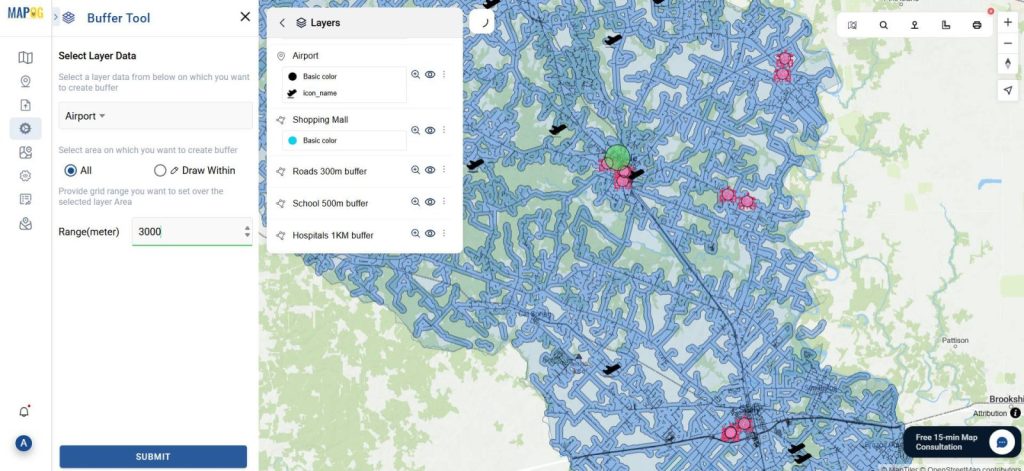
This method helps in identifying zones where multiple services converge—perfect for assessing livability and growth potential.
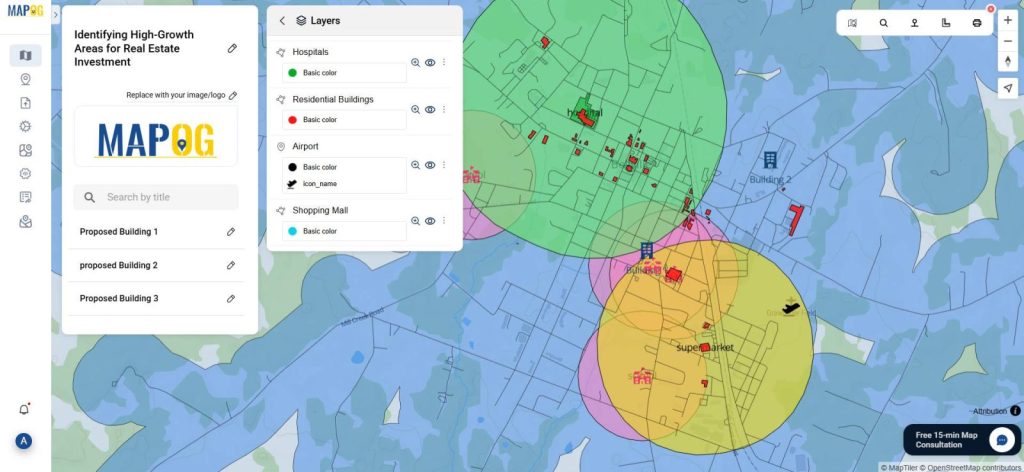
4. Spot the Opportunity Zones
By overlapping buffer layers, I visually pinpointed areas where all essential services align. These are your real estate goldmines—locations with high potential for residential or commercial growth.
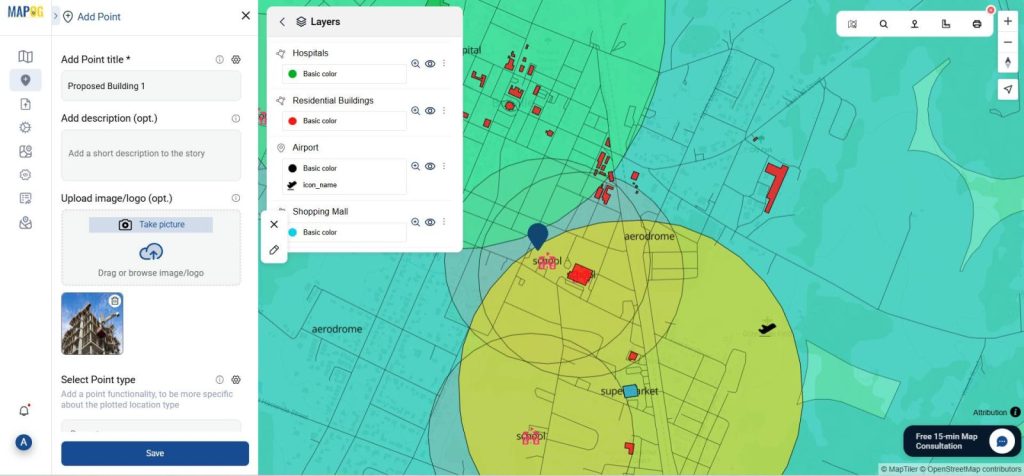
5. Add Story Points for Insightful Details
Using the Add Story feature, I dropped points in suitable zones, added custom titles, descriptions, and even attached local images. This created an engaging, shareable narrative layer on top of the data.
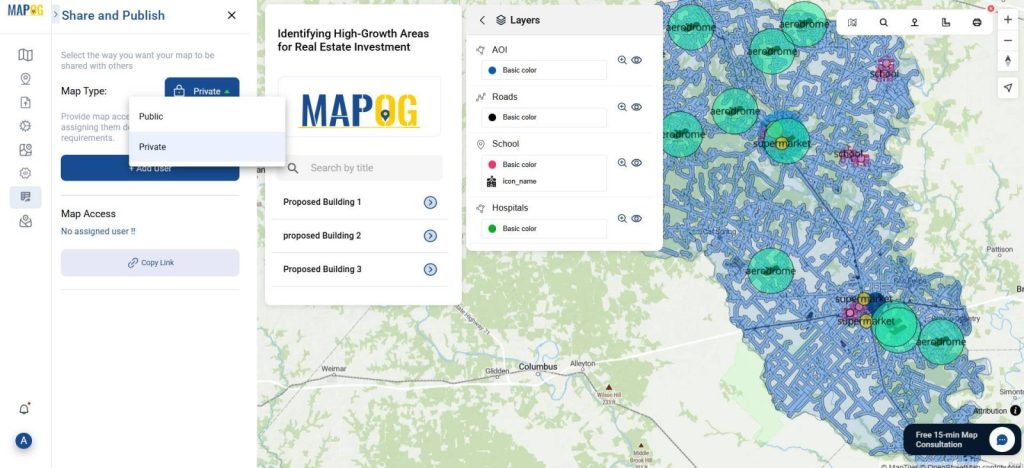
6. Preview and Share the Analysis
Lastly, I used the preview and share option to generate a public link, making it easy to showcase my findings to potential clients, partners, or developers.
Industry Use & Benefits
GIS for real estate isn’t just for large developers. Independent agents, government bodies, and even small investors use it to:
- Evaluate land value based on surrounding infrastructure.
- Predict future growth areas based on ongoing development.
- Make compelling presentations backed by spatial proof.
- Build interactive real estate stories to win over clients.
Real estate is more than location—it’s about location intelligence. With GIS tools like MAPOG’s buffer analysis and story tagging, decision-making becomes visual, strategic, and precise.
GIS Data Used Identifying High-Growth Areas
Conclusion
If you’re in real estate, GIS isn’t just helpful—it’s essential. Using GIS for real estate means stepping into a new era of investment intelligence where your decisions are powered by data and visual clarity. With tools like MAPOG‘s Buffer tool and Add Story, spatial planning becomes effortless. Whether you’re analyzing a city block or a sprawling suburb, the smart use of GIS can uncover opportunities others simply can’t see.
Here are some other blogs you might be interested in
- Embedding Maps Boosts Website Engagement: Real Estate Agents
- Land Price Mapping: GIS-Based Visualization for Real Estate Insights
- Land Parcel Mapping with GIS: Create Accurate Polygon Maps for Urban Planning & Real Estate