Creating interactive maps no longer requires technical skills or expertise in geographic information systems. Today, even individuals without a background in GIS can visualise and analyse spatial data to better understand real-world issues. Whether you’re a teacher, student, or policy planner, interactive maps can powerfully communicate patterns, challenges, and opportunities in education, healthcare, infrastructure, and more. With the help of easy-to-use platforms like MAPOG, anyone can create visually compelling maps to support learning and decision-making, without writing a single line of code.
an intuitive and user-friendly no-code GIS platform, you can effortlessly create powerful, interactive maps.
KEY CONCEPT: Why This Matters
Interactive maps help reveal the spatial relationship between services and the populations they are meant to serve. In the context of education, for example, mapping school locations alongside population data can uncover underserved regions, identify where new educational institutions are needed, and estimate the number of people who would benefit from improved access. A user-friendly platform such as MAPOG makes this process accessible by allowing users to upload data, apply visual tools like heatmaps or buffers, and share interactive outputs—making complex spatial analysis both understandable and actionable for all.
Step 1: Create Interactive Maps Easily Start Your Project on MAPOG
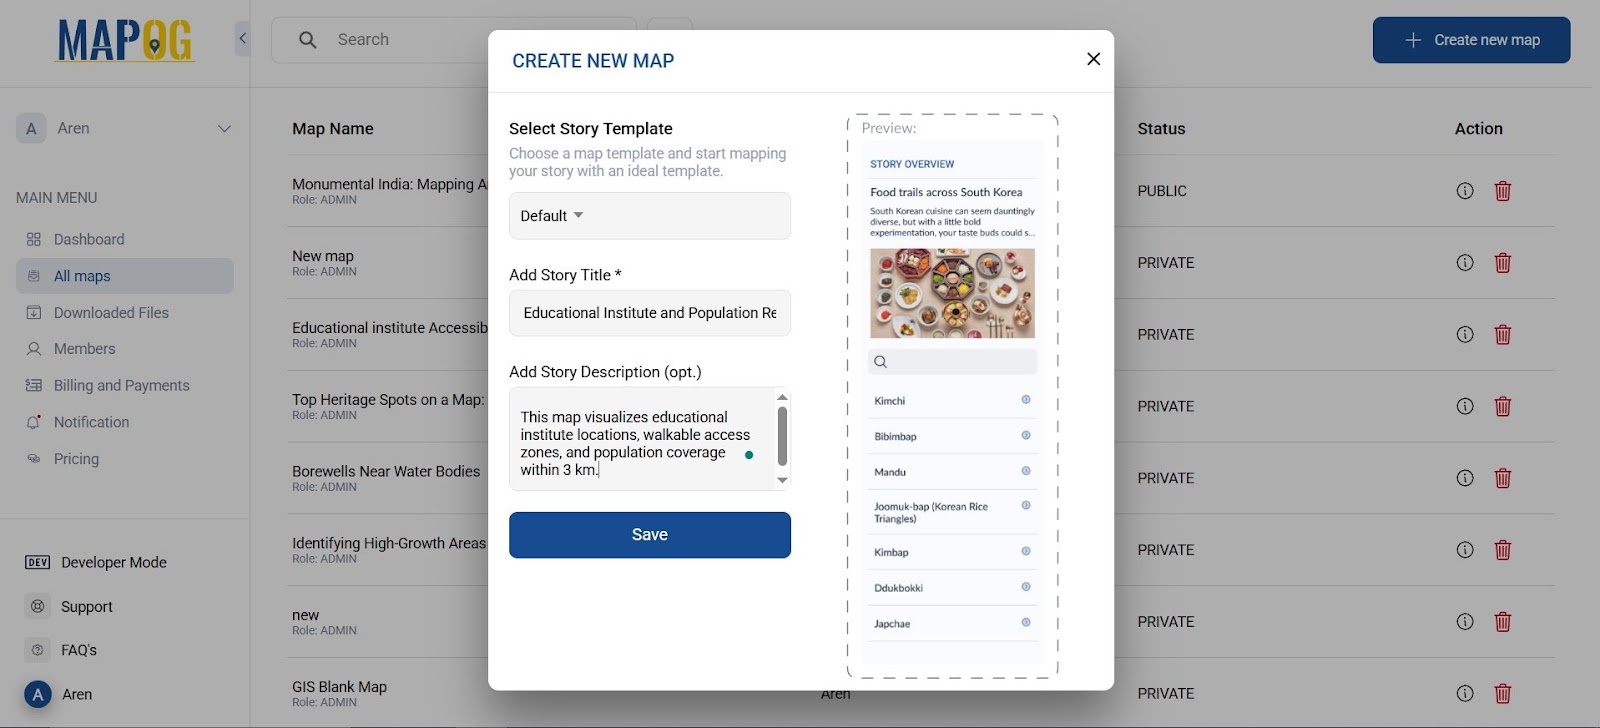
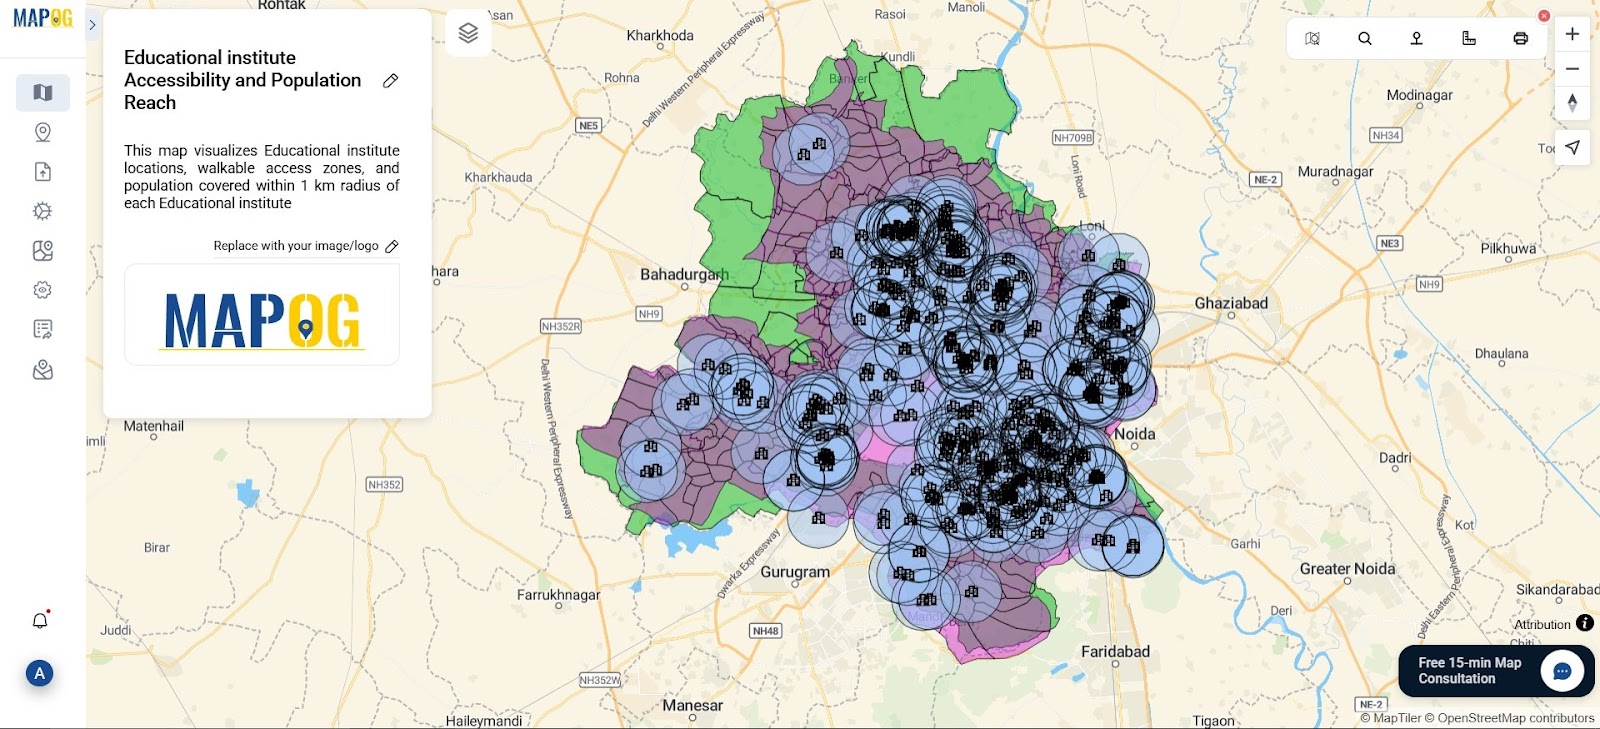
Start by logging into the MAPOG platform. If you’re new, signing up is quick and easy. Once on your dashboard, click “Create New Map,” and assign a meaningful title like “Educational Institute and Population Reach.” Add a short description.
Step 2: : Create Interactive Maps Easily by Adding Educational Institute Data
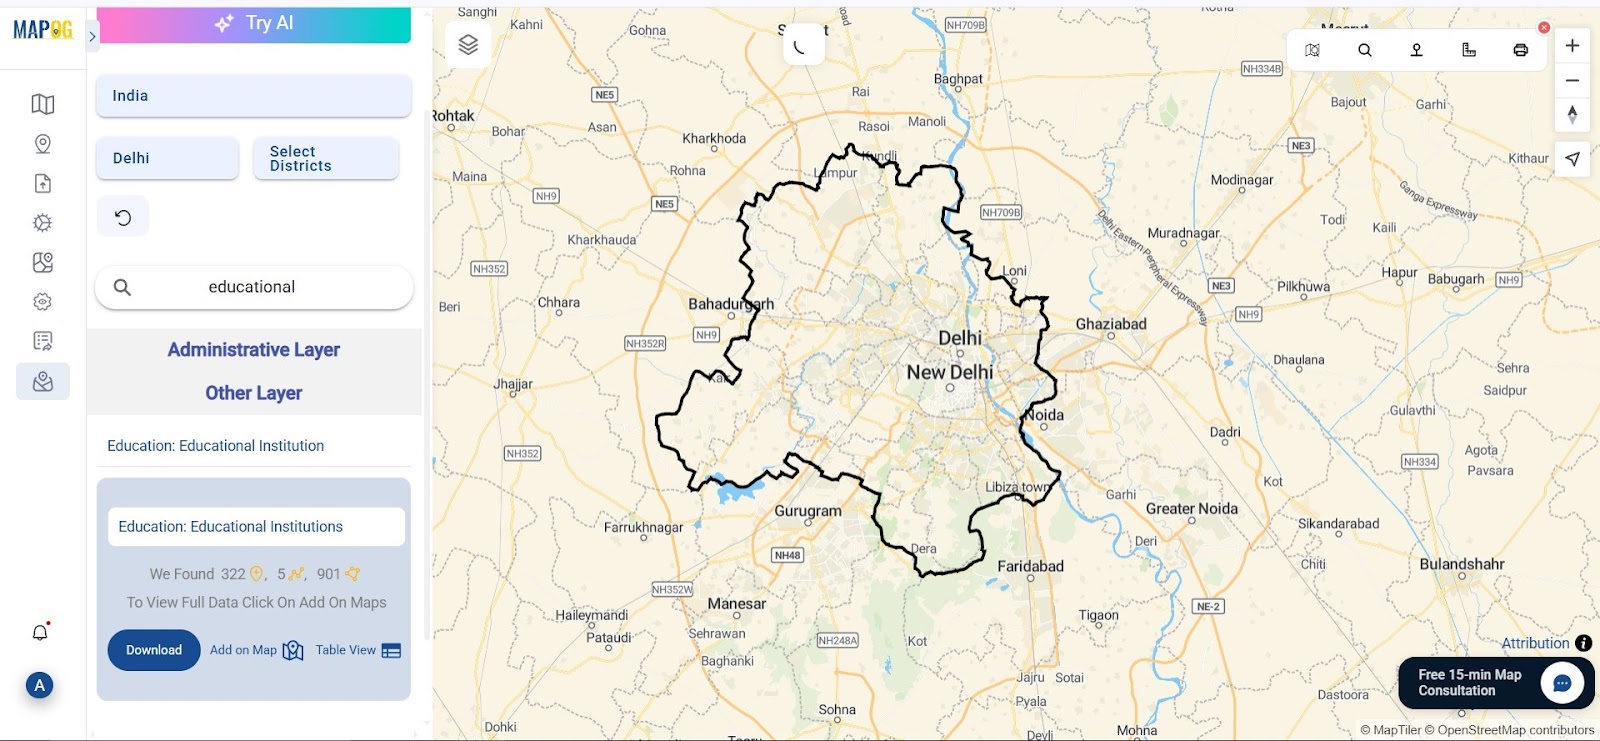
Next, go to the GIS Data within MAPOG and select your desired area, down to the district or block level. Search for a dataset labeled “Educational Institute” and add it to your map.
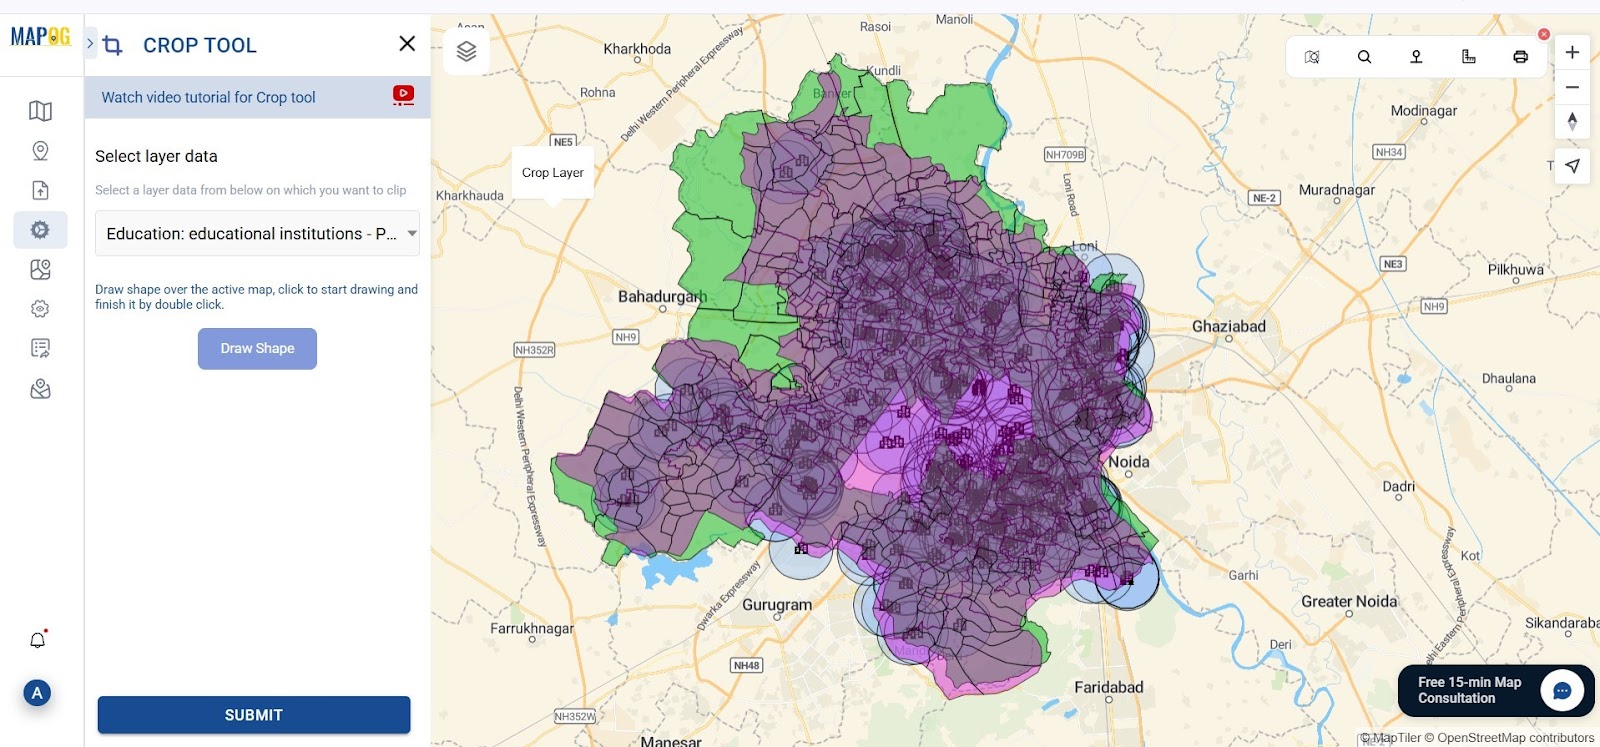
Step 3: Use Buffer Tool to Create Interactive Maps Easily
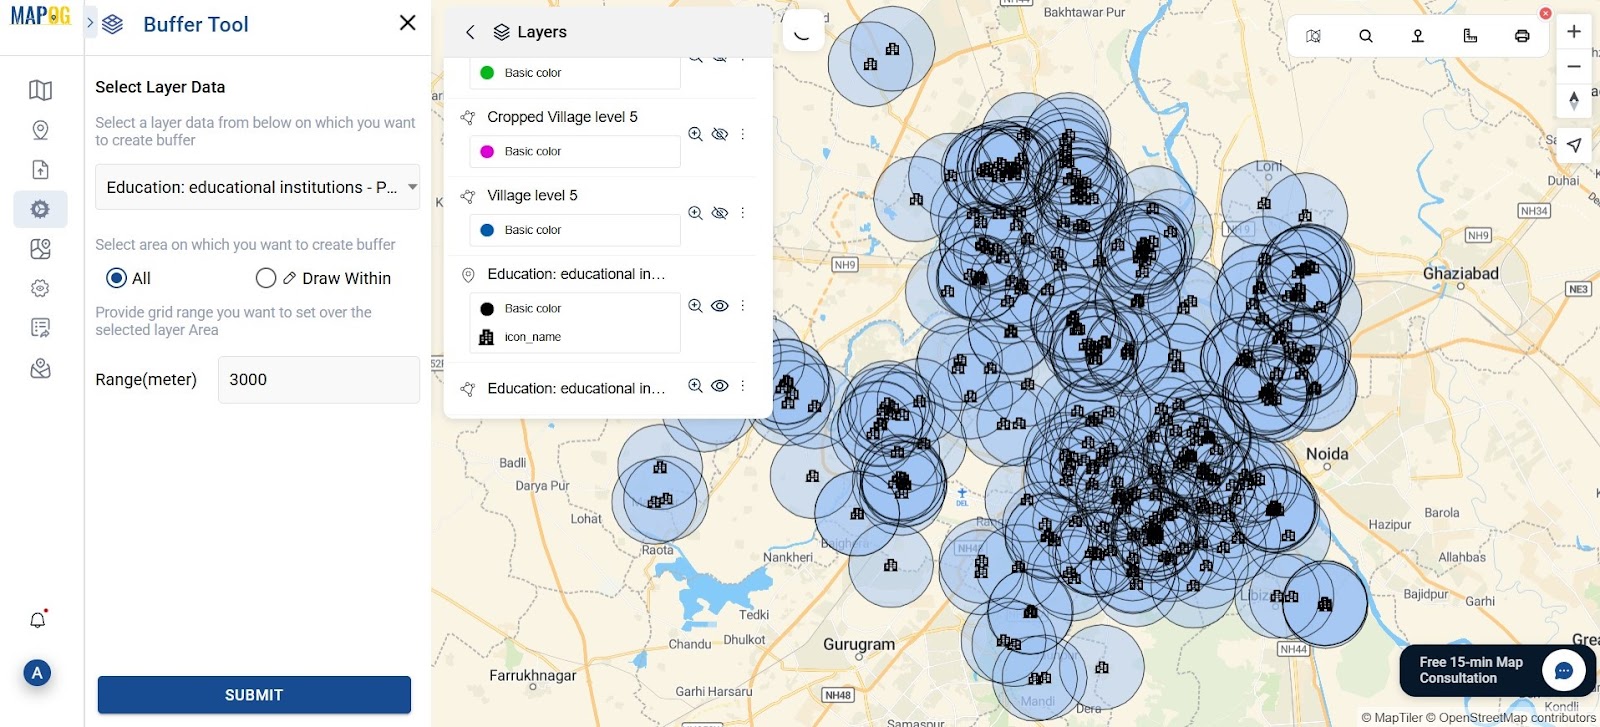
Now, use the Buffer Tool in MAPOG to analyze reachability. Select your educational institute layer and define a buffer radius, typically 3 kilometers.
Step 4: Add Population Data to Create Interactive Maps Easily
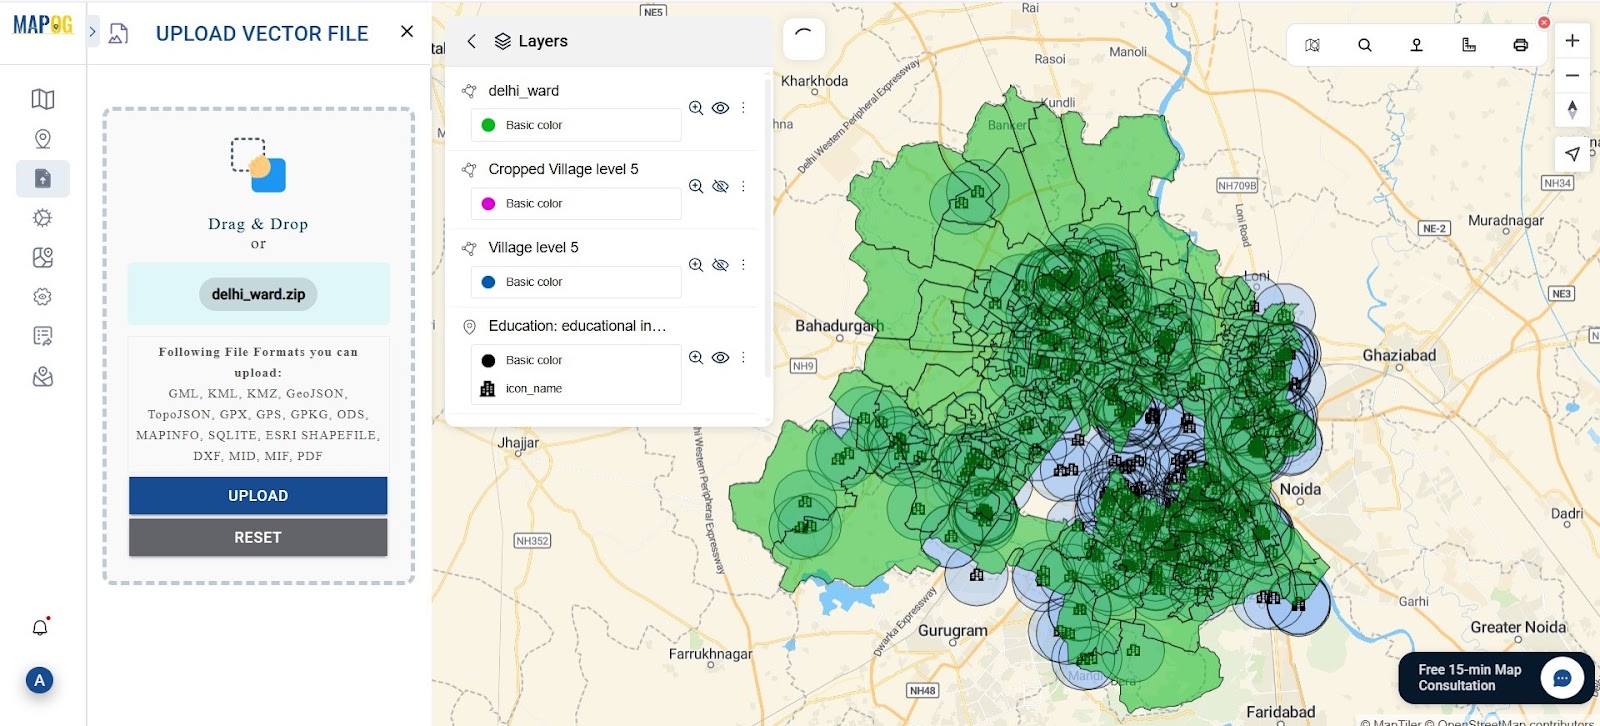
Go back to the Add Data then upload vector file and search for population layers, such as ward-level or census block data. Add this polygon layer to your map.
Step 5: Clip Population Data Using Buffer Zones
Now comes an essential spatial operation. Use the Clip tool , select the population layer as the base, and your 3 km buffer zone layer as the clipping mask. Label it as “Population Within Educational Institute Access” to make its purpose clear.
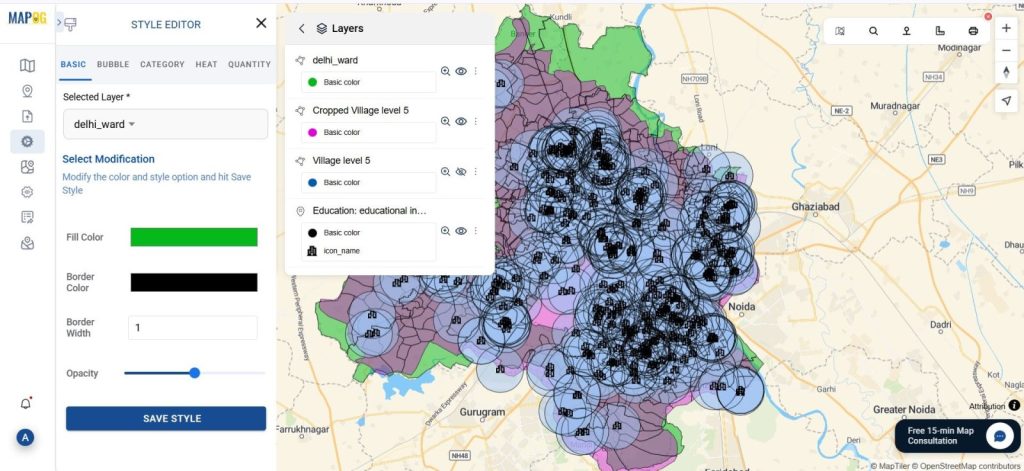
Step 6: Style and Customize Your Map
Make your map visually engaging with MAPOG’s Style Editor. Use light blue for buffer zones, bold black icons for educational institutes, and gradient shades for population density. This ensures clarity and insight. Viewers can interact by clicking icons, zooming in, and exploring rich contextual details—transforming your map into a powerful storytelling tool.
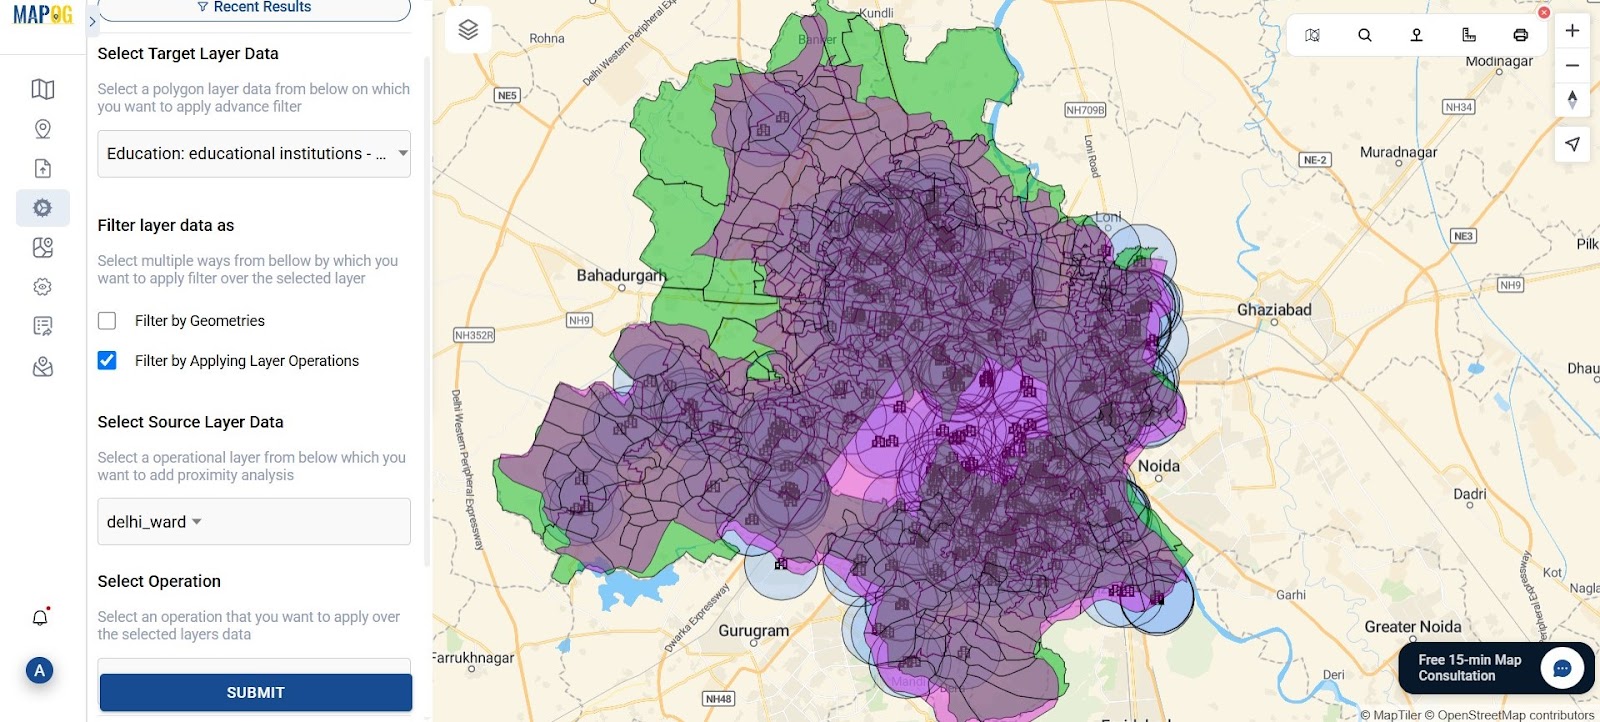
Step 7: Use Advanced Filter for Deeper Analysis
To extract targeted insights, go to the Advanced Filter tool. Use the Advanced Filter tool to extract insights by applying a spatial join—select the Educational Institute layer as the target and Population as the source with the “is within” operator. This filters institutes located in populated areas. For example, 292 features mean 292 institutes serve residential zones, revealing coverage areas..
Step 8: Publish and Share to Create Interactive Maps Easily for Wider Impact
Once satisfied with your visualization, click “Publish and share.” MAPOG gives you options to generate a live, shareable link or embed the map directly into a WordPress blog or website using HTML code.
Industry & benefits and GIS data used?
MAPOG’s interactive mapping empowers education planners, NGOs, and Smart City teams to identify underserved areas and plan schools using spatial data—no GIS skills needed. With tools like Buffer, Clip, and Filters, analyzing access within 3 km becomes simple and impactful.
GIS data used: Educational institutes
Conclusion: Maps That Drive Educational Equity
With MAPOG’s no-code tools, you can build an interactive educational accessibility map in minutes. From adding data to styling visuals and applying filters, it helps answer key questions like who has access to education and where gaps exist. For planners and educators, it’s a powerful way to turn insight into action, because in education planning, seeing is believing.