Uploading GIS data is the crucial first step in any spatial analysis workflow. Whether for urban planning, environment, infrastructure, or disaster response, clean and structured data ensures accuracy in representing real-world features and relationships.
Using correct formats allows mapping software to interpret boundaries and attributes effectively. MAPOG, a leading cloud-based GIS platform, supports various formats for fast, beginner-friendly uploads. This guide walks you through uploading shapefiles, CSVs, Excel files, previous project files, and pre-loaded GIS data.
Key Concept: Understanding Data Upload in GIS
GIS data comes in several forms. Shapefiles are classic vector formats storing geometry (points, lines, polygons) and attribute data. They’re useful for mapping roads, boundaries, and rivers.
CSV and Excel files work well when mapping tabular data using coordinates or WKT (Well-Known Text) geometry. These files are handy for survey results, incidents, or any location-tagged dataset.
MAPOG also offers thematic GIS data libraries and lets you reuse files from older projects, saving time and promoting consistency across maps.
Steps Involved in Uploading GIS Data on MAPOG
Step 1: Go to the Mapping Platform
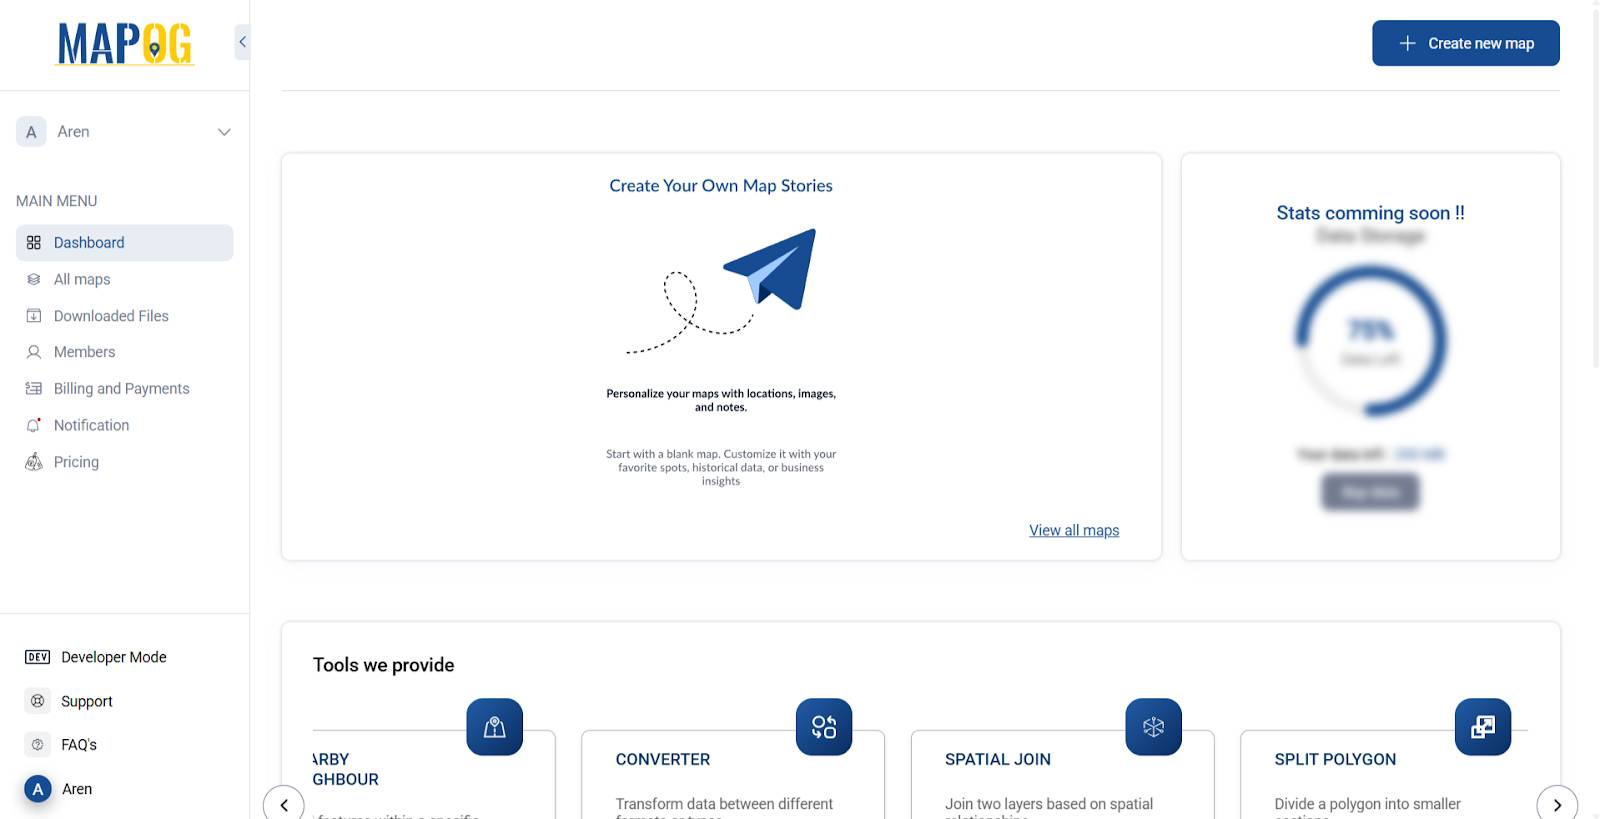
Visit MAPOG. Click “Create New Map” to start building your project.
Step 2: Add Basic Map Information
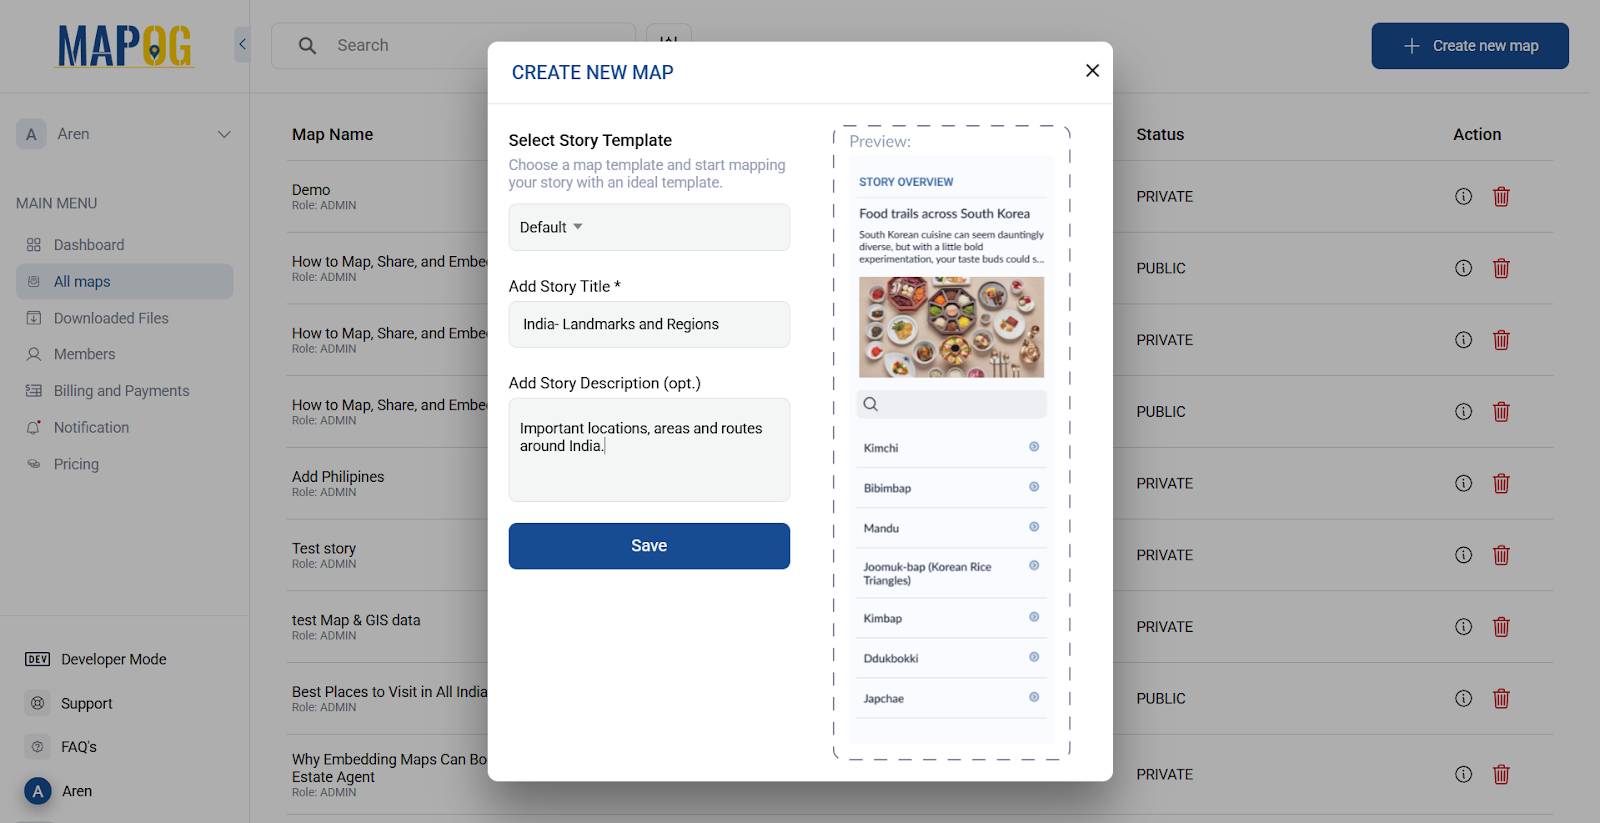
Enter the map title, a short description, and optionally upload a cover image. Click Save to proceed.
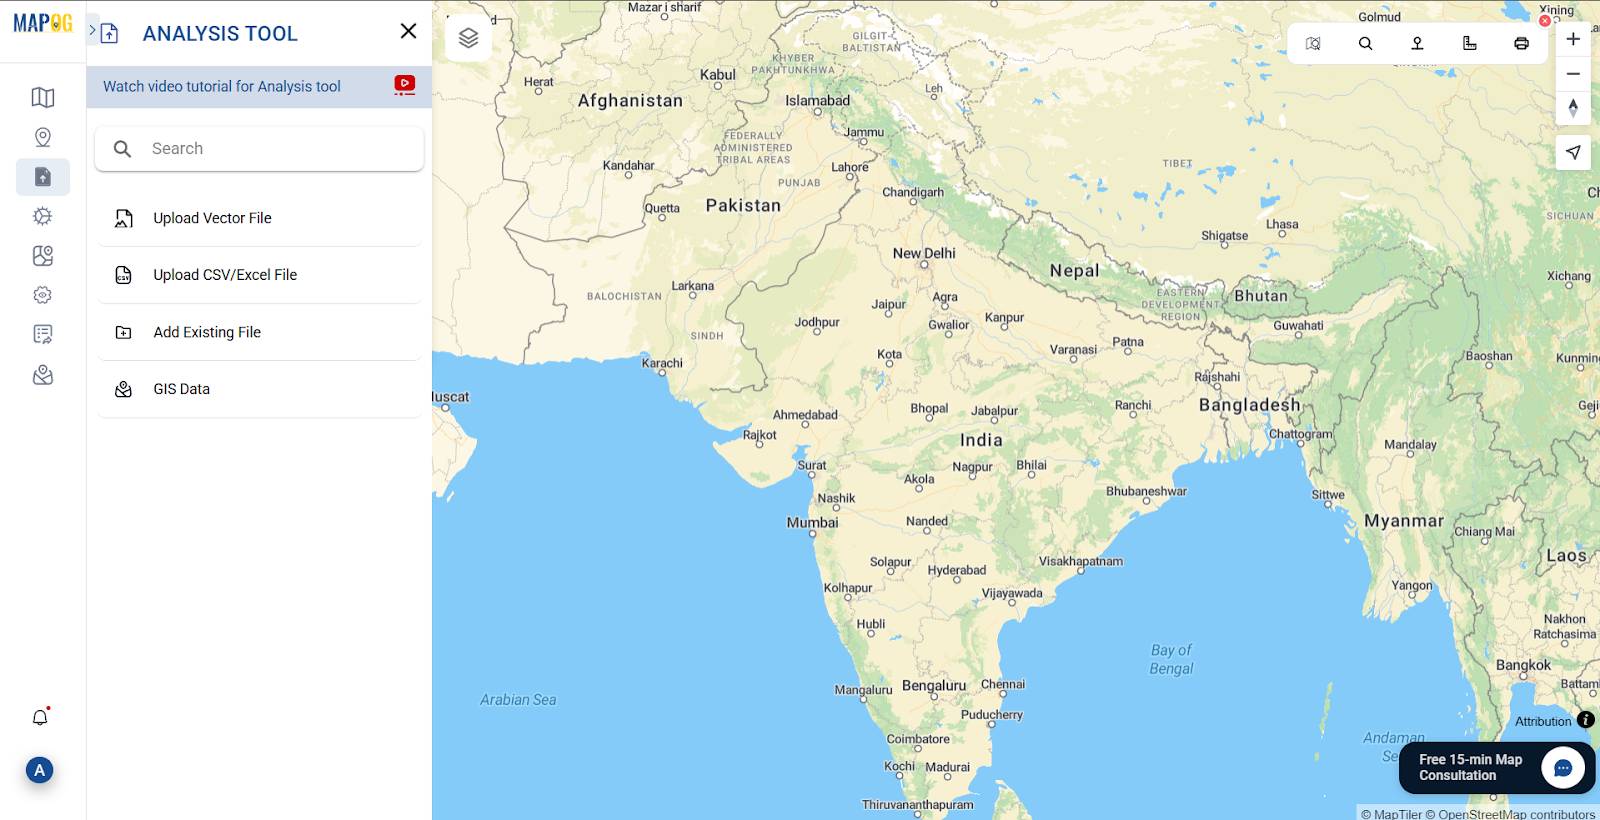
Step 3: Access Data Upload Options
Click “Add/Upload Data”. MAPOG offers four upload options based on your data type.
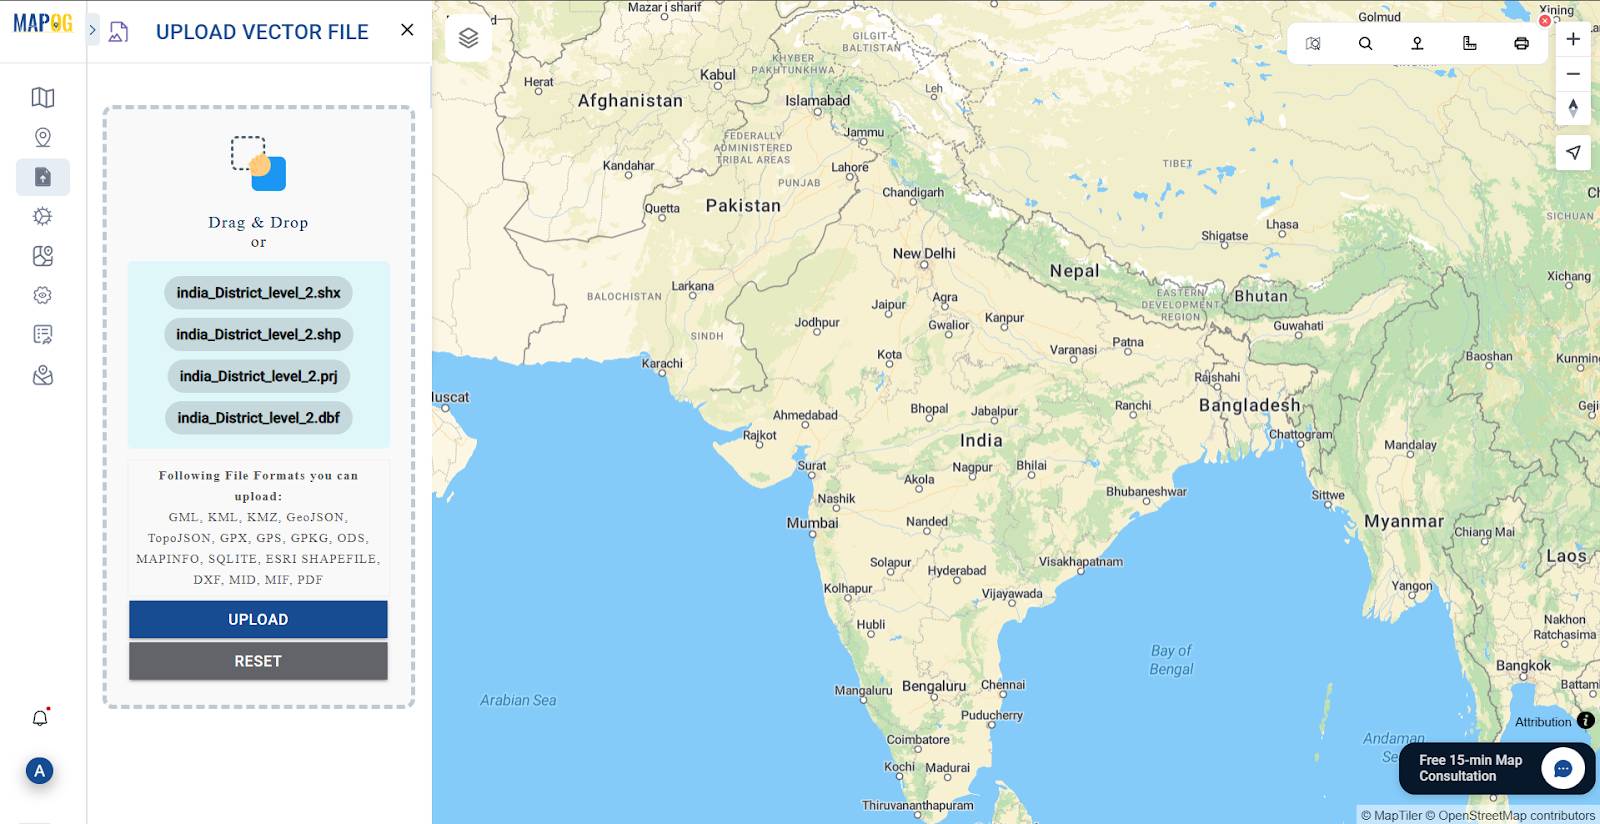
Step 4: Uploading Vector Files (Shapefile, KML, GeoJSON)
Click Upload Vector File, then browse and select your file.
If uploading shapefiles, zip together the following files: .shp, .shx, .dbf, and .prj.
Upload formats also include GML, KMZ, GeoJSON, TopoJSON, GPX, GPKG, MAPINFO, DXF, and PDF.
Use vector files to display roads, boundaries, pipelines, or site locations with geometry.
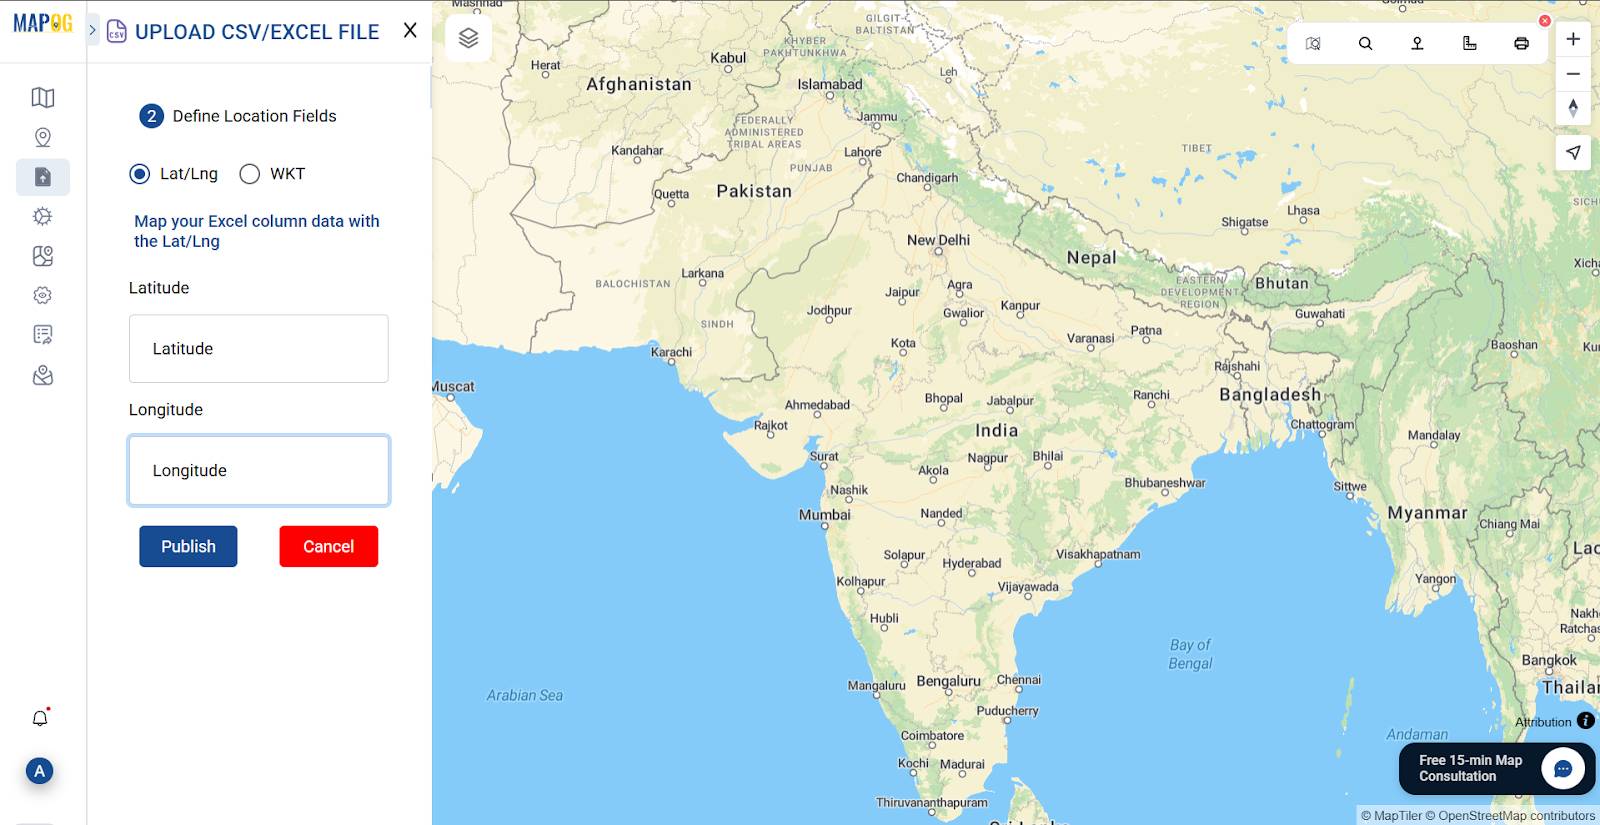
Step 5: Uploading CSV or Excel Files (Coordinates or WKT Geometry)
Click Upload CSV/Excel File and choose your .csv, .xls, or .xlsx.
Select Longitude and Latitude columns, or ensure valid WKT geometry in a column.
Ideal for mapping survey data, events, or demographic info.
Always preview uploaded data to verify correct plotting.
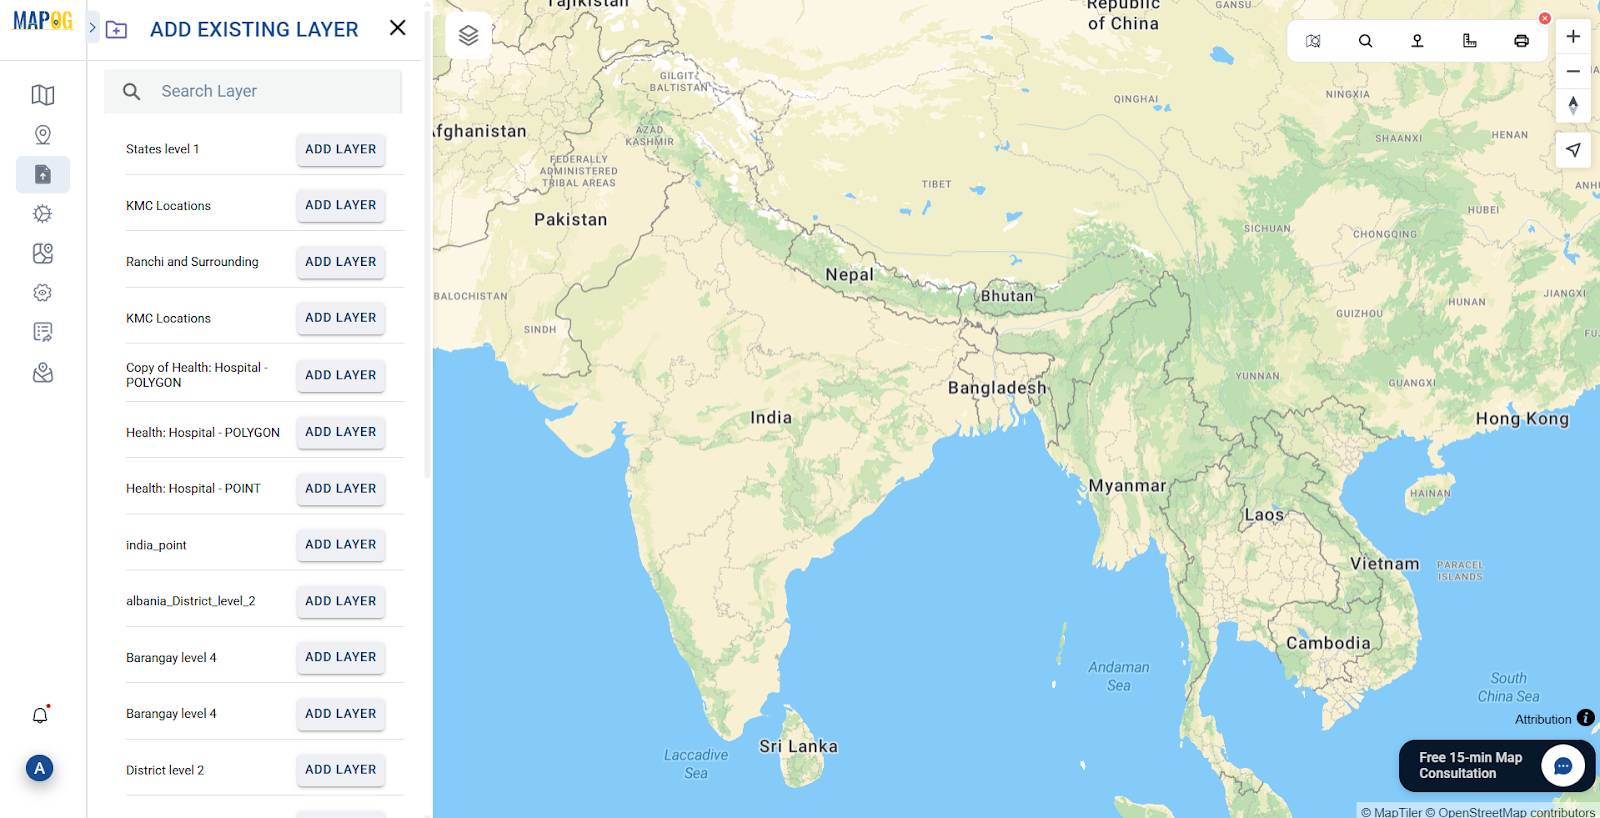
Step 6: Adding Existing Files from Other Projects
Select Add Existing File. Browse through your uploaded MAPOG files.
Choose relevant layers to add instantly. Saves time and maintains consistency.
Great for collaborative teams and iterative updates.
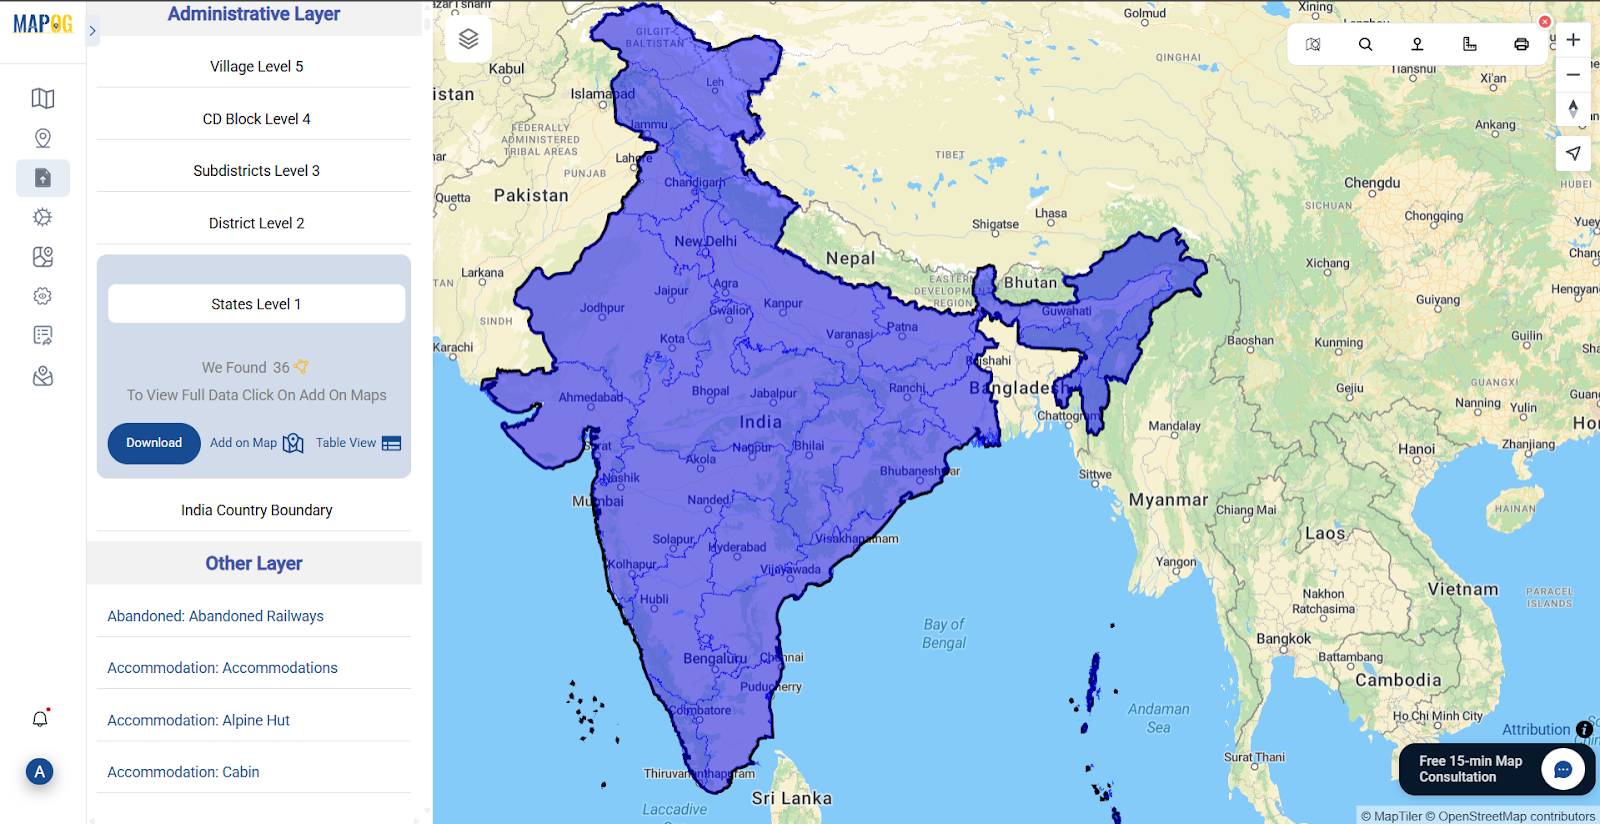
Step 7: Using Pre-Created GIS Data from MAPOG’s Library
a. Click GIS Data in the sidebar.
b. Choose your country or area.
Browse and add from layers like:
- Administrative boundaries
- Roads and transport
- Schools, colleges
- Agriculture and waterbodies
These datasets provide essential context to your maps.
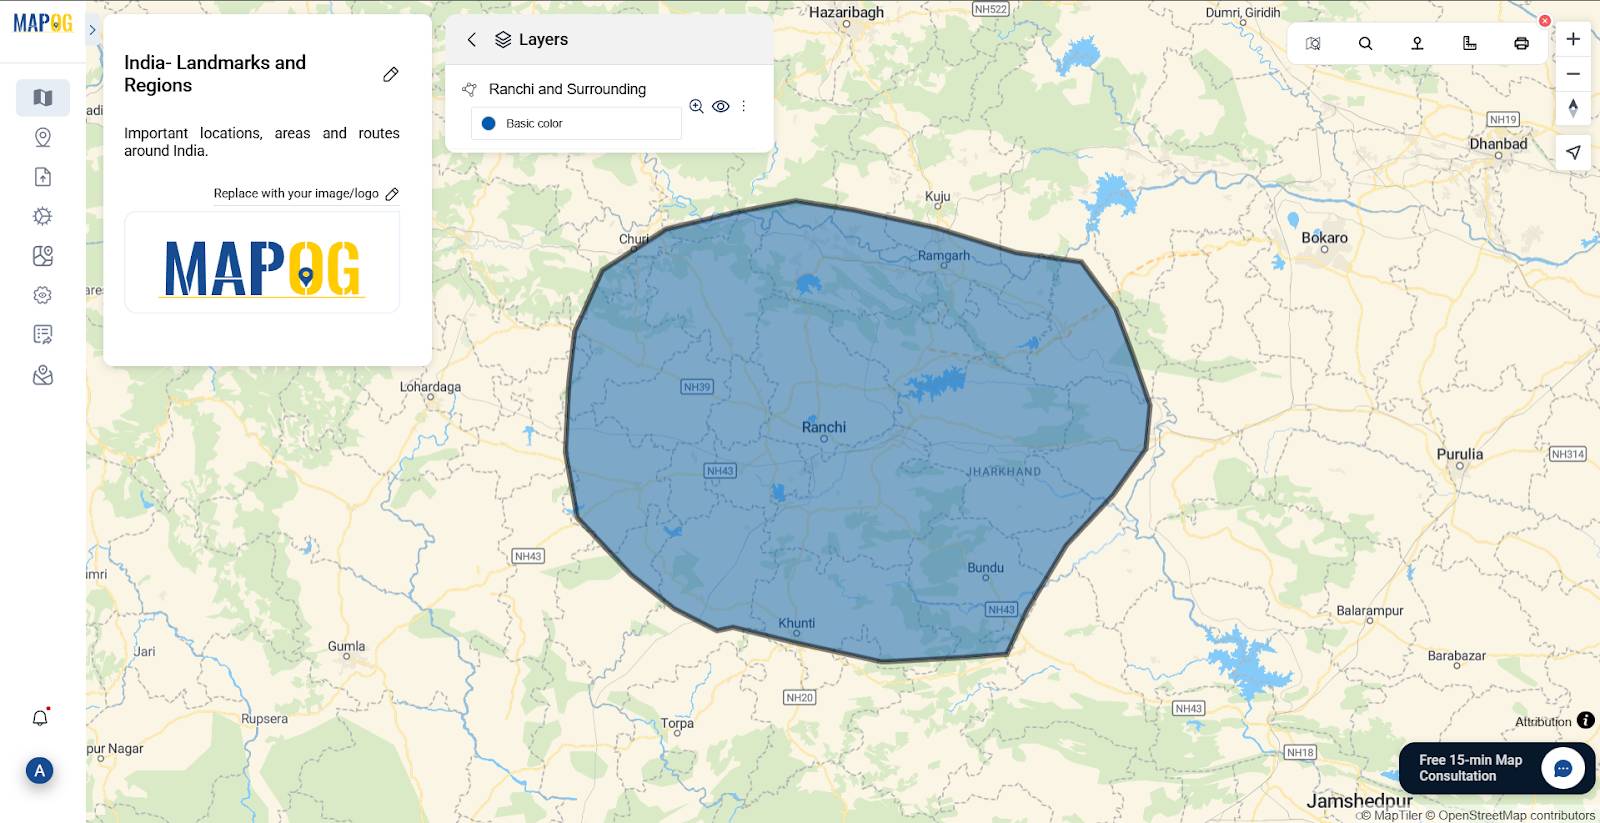
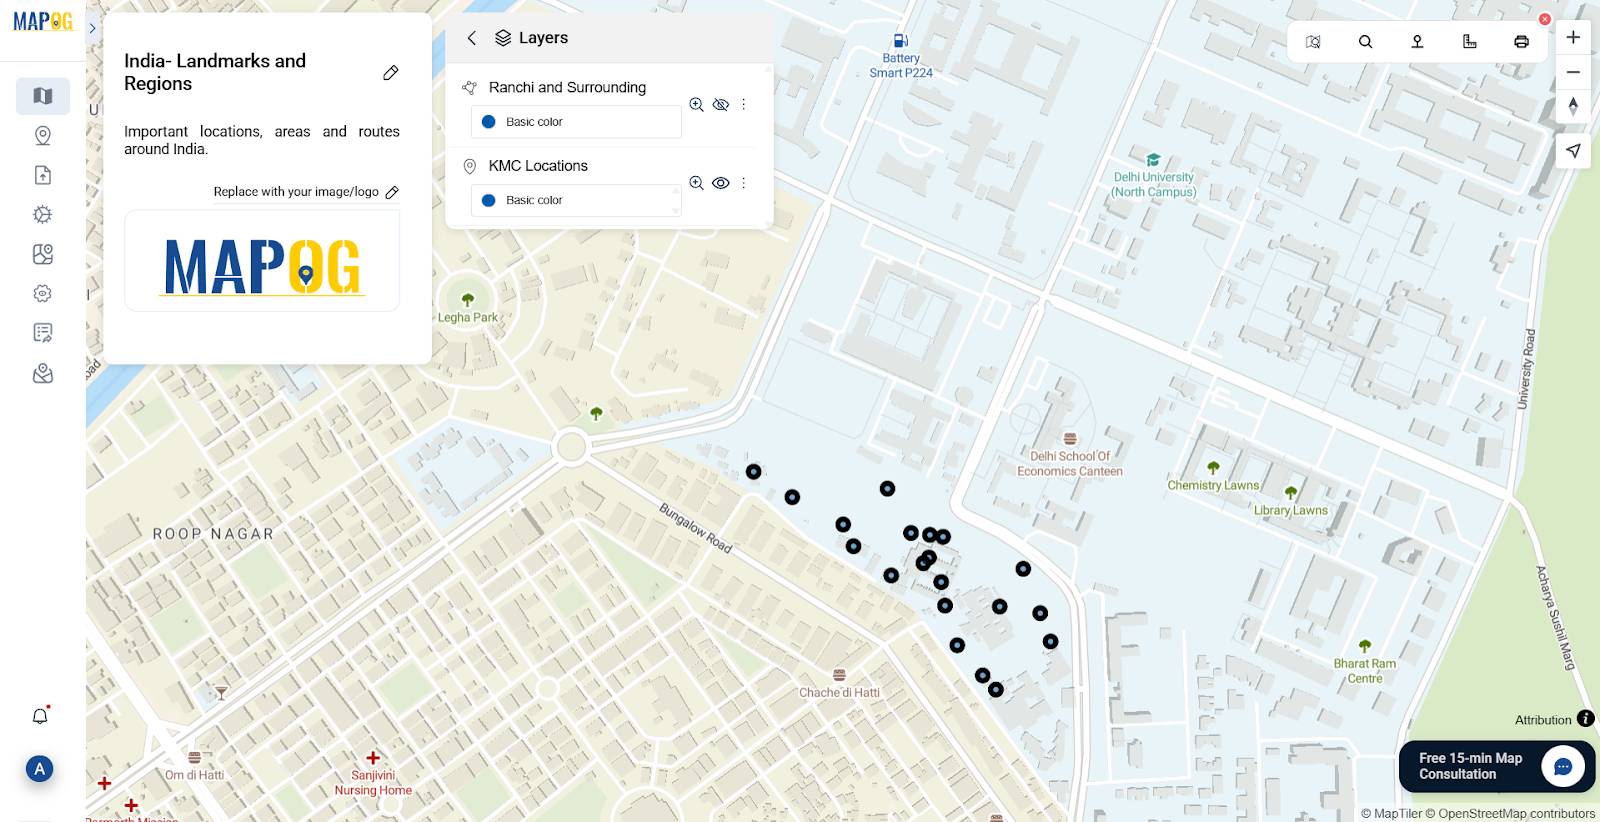
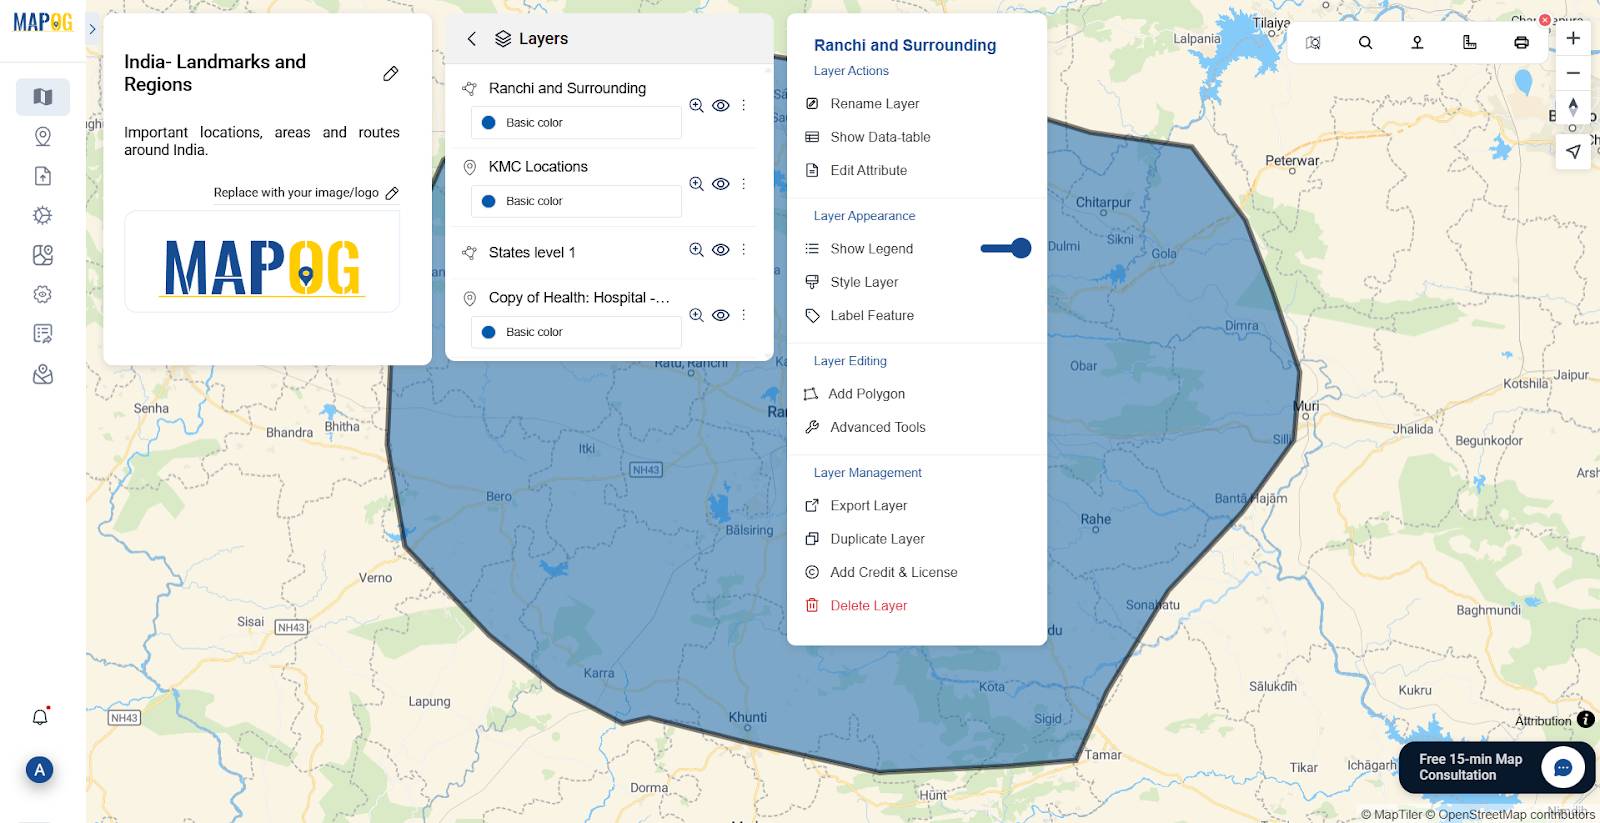
Step 8: View and Manage Layers from the Layers Panel
Once data is uploaded, click Layers (top-right corner) to see all active layers.
Rename, label, style, export, or delete layers to customize and organize your project effectively.
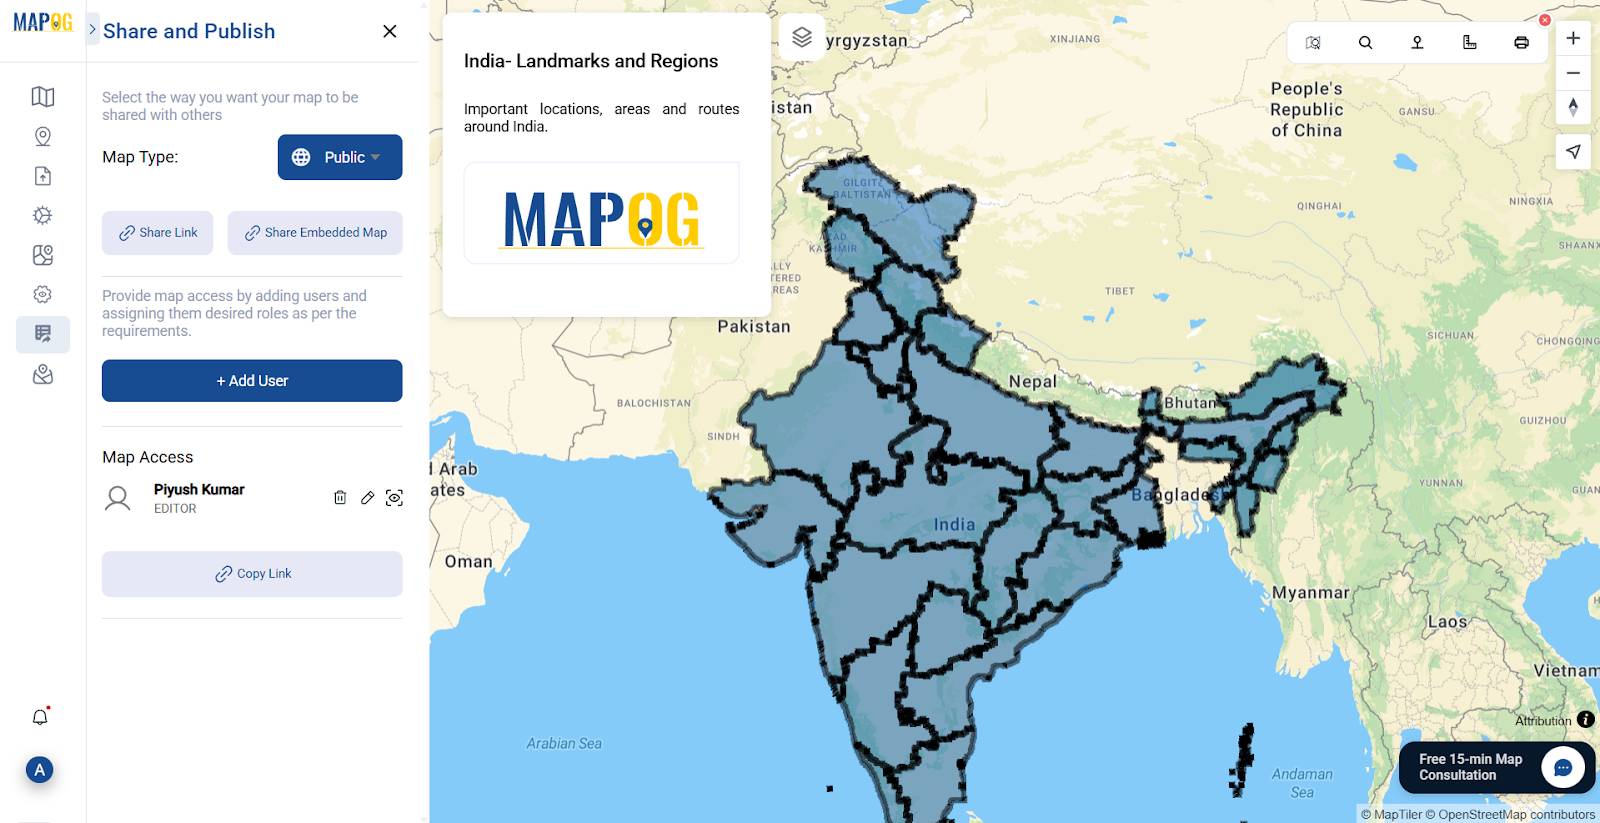
Step 9: Save and Share
Go to the Preview and Share, You can share maps via link or keep them private. Your project is safely stored for edits later.
Industry and Domain Applications of GIS data
MAPOG’s flexible uploads are used in:
- Urban planning – zoning maps, traffic design
- Environmental science – deforestation tracking, pollution monitoring
- Public health – disease mapping, resource allocation
- Disaster management – flood risk zones, relief logistics
- Infrastructure – roads, water, electricity mapping
GIS uploads also support NGOs, researchers, and policymakers for grant proposals and real-time mapping.
Typical GIS layers include administrative boundaries, survey points, road networks, facilities, and environment features. Researchers also track agricultural data or election turnout using these uploads.
Conclusion: Map Faster, Smarter, and Better
Quality data is the base of all meaningful GIS work. MAPOG streamlines this process with user-friendly uploads across multiple formats—so users can focus on analysis, not file compatibility.
From shapefiles to spreadsheets, and from built-in libraries to past project layers, MAPOG equips users to create data-rich maps with precision. Start mapping smarter today with MAPOG.
Try MAPOG today and map your data into a smarter future.
GIS DATA USED: States Level 1
If you found this article helpful, you may also enjoy reading these related articles on MAPOG: