Businesses today are moving beyond static visuals and lengthy reports — they’re using interactive maps for better engagement to turn raw data into visual stories. From real estate firms displaying project portfolios to tourism companies mapping destinations, and logistics brands tracking operations, interactive mapping platforms like MAPOG are helping businesses communicate more effectively and engage audiences like never before. Even in retail and events, hence, tools like MAPOG’s Interactive Retail & Lifestyle Events Map make it easier for users to explore venues and discover events visually.
Key Features
The power of interactive maps for business engagement, lies in blending location intelligence with visual storytelling. Thus, each point can hold photos, files, links, or live data—turning static info into interactive experiences.
- Real Estate: Highlight project status, nearby amenities, and 3D renders. (See how businesses are doing this in “Turning Property Brochures into Interactive Maps” — a modern approach to real estate marketing.)
- Retail: Map outlet networks and service zones.
- Tourism: Build interactive itineraries.
- Corporate: Thus, show CSR impact or franchise growth.
Hence, with filters, visuals, and linked resources, businesses make data easy to explore—boosting trust and engagement. With this Buisnessess are making Interactive Maps for Better Engagement for users.
Steps to Build Your Interactive Business Map with MAPOG
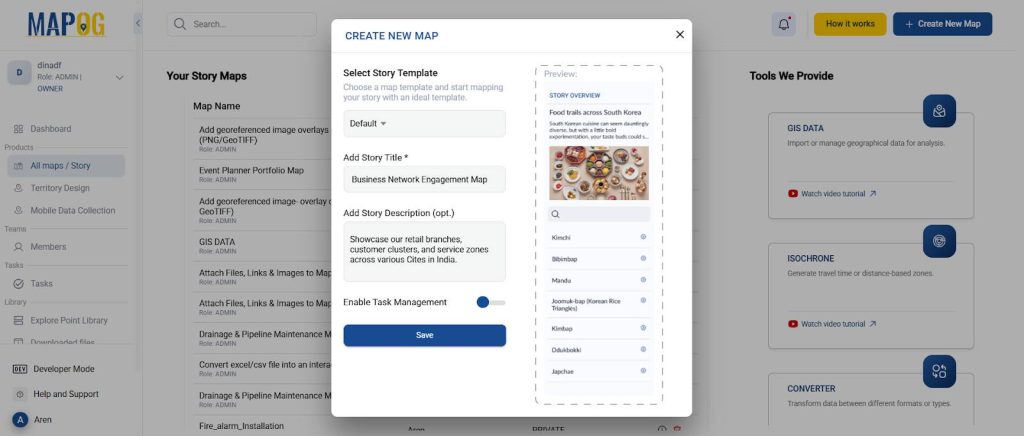
Step 1: Start a New Project
Log in to MAPOG and create a new story map.
Name it (e.g., “Business Network Engagement Map”) and add a short description of the goal.
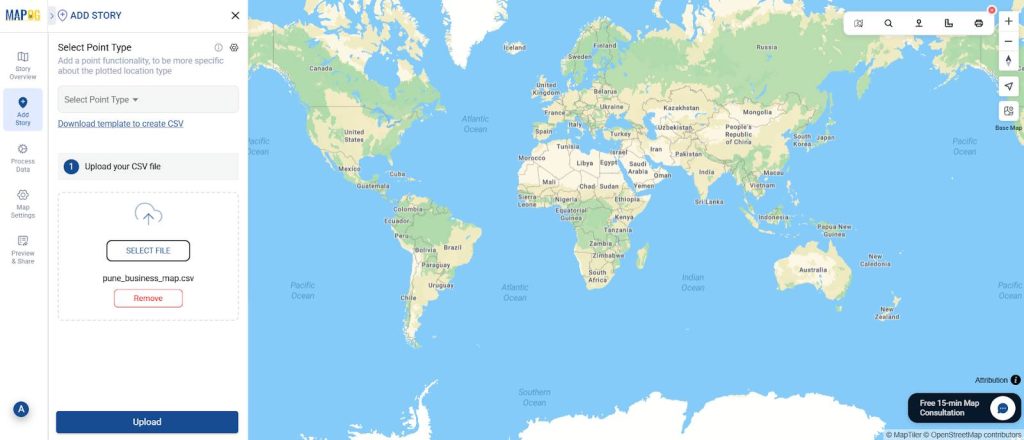
Step 2: Upload Data with CSV
Plot your offices, outlets, or project sites directly on the map.
Go to “Add Story” → “Add by Uploading CSV/Excel”
Then, prepare a CSV with fields like Name, Address, Category, Status, Description, Media (links/images/PDFs).
Import the CSV directly—perfect when you have many locations and want to save time.
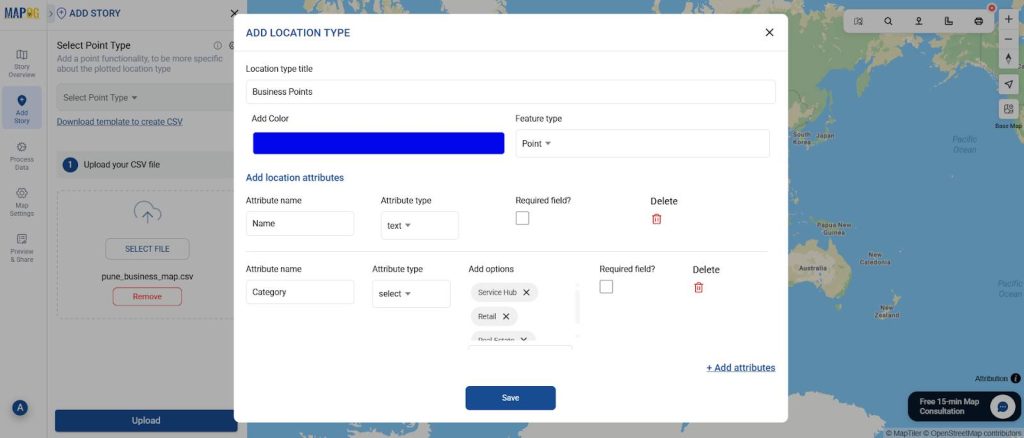
Step 3: Set Up Location Types & Custom Fields
In the “Select Point Type” menu, open “Location Type Management”
Create attributes that match your CSV columns (e.g., Category, Status, Contact, Operating Hours, Performance Rating).
Add the corresponding Point Type first so your points match correctly.
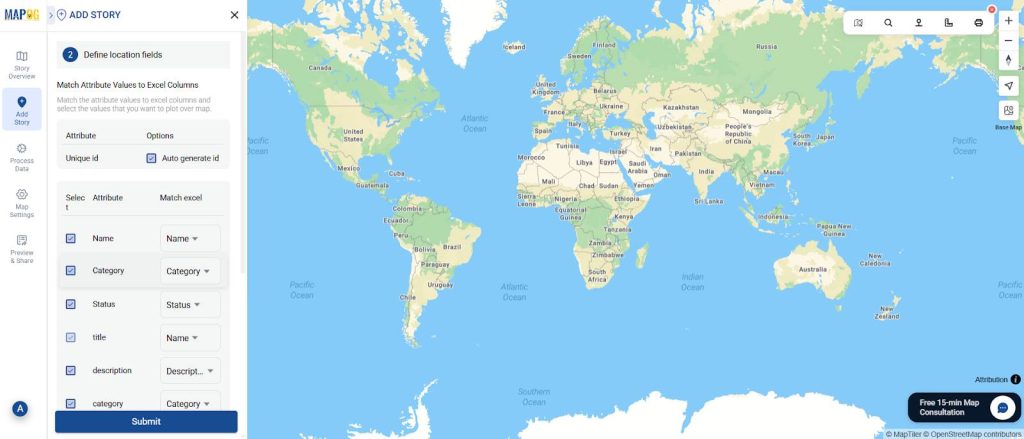
Step 4: Match Attributes with CSV
Use “Match Excel” to link your custom attributes with CSV columns (including Latitude and Longitude if present).
Submit to auto-fill points—MAPOG will populate large datasets quickly.
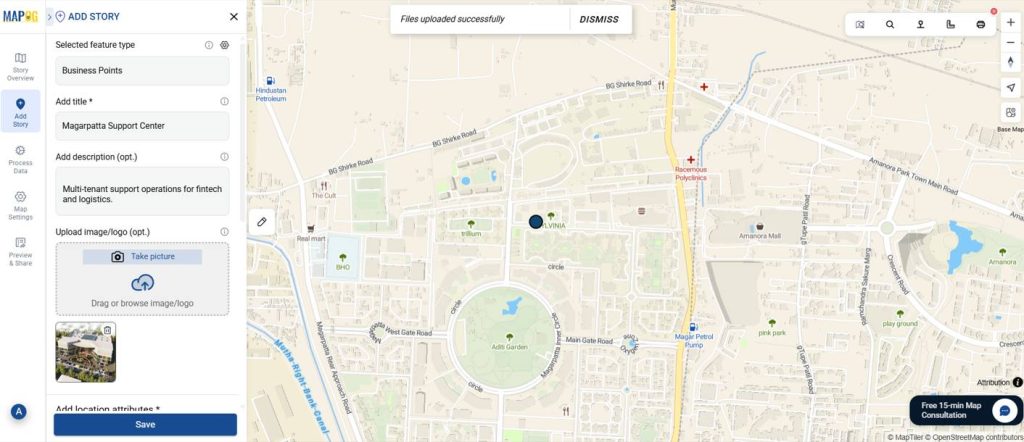
Step 5: Add Images
Go to each mapped point and add relevant images — such as storefronts, project renders, or logos — to make your map visually rich and recognizable.
These visuals give each location context and make the map more engaging to explore.
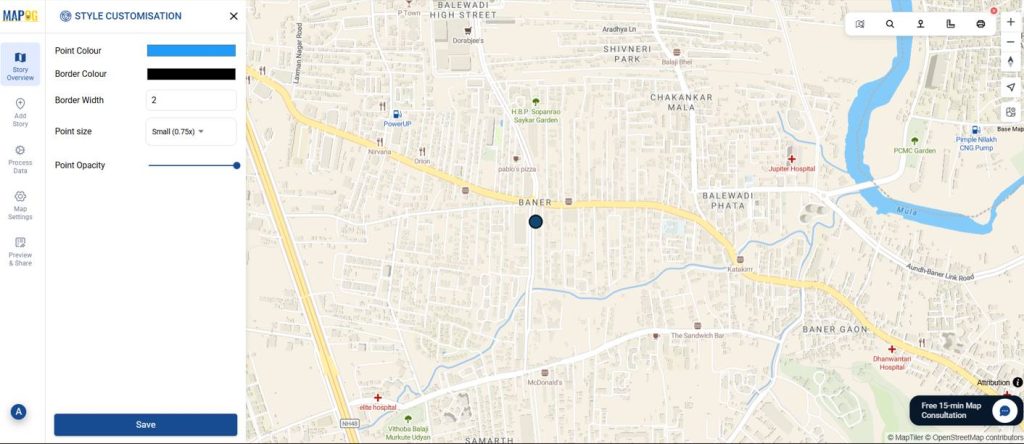
Step 6: Style Customization
Make your map visually intuitive by assigning colors based on business categories by going to the “Style Customization” tab:
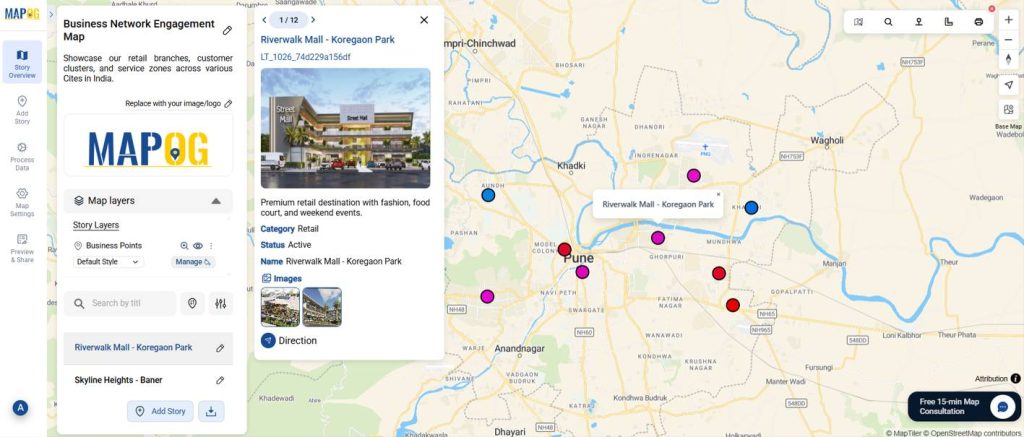
- Red = Service Hubs
- Blue = Real Estate Projects
- Purple = Retail Locations
You can also adjust marker sizes or shapes for emphasis — for example, larger icons for flagship outlets or key business centers.
Hence, this style customization improves readability and helps users instantly distinguish between different types of business points.
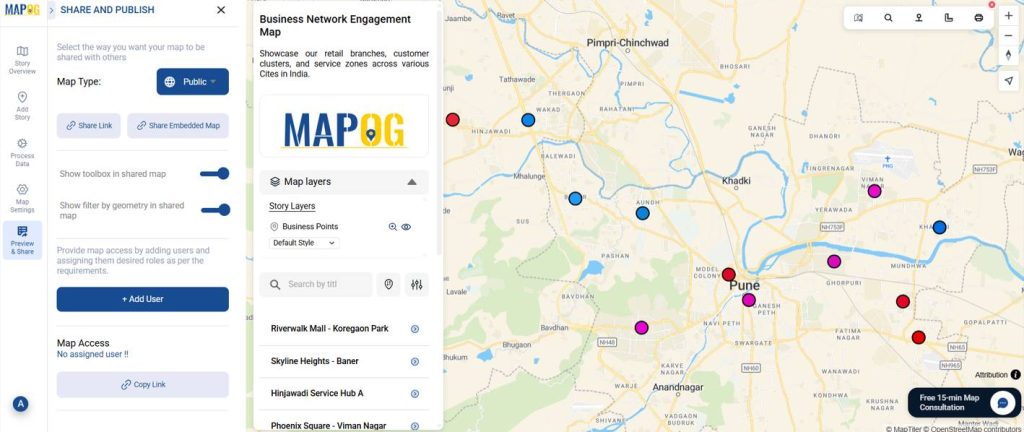
Step 6: Share & Publish
Go to “Share & Publish”
Choose Public or Private access.
Finally, share the link, email it to stakeholders, or embed it on your website.
Why Businesses Are Making the Switch
Businesses are switching to interactive maps for three big reasons:
- Engagement: Interactive visuals keep audiences exploring.
- Transparency: Real-time data builds trust with customers and investors.
- Insight: Visual analytics reveal spatial trends and opportunities.
hence, even in real estate, interactive portfolio maps help companies organize and showcase projects more effectively — a clear example of how visual storytelling enhances business communication.
Conclusion: Maps that Tell Business Stories
An interactive business map is more than a data visualization — it’s a storytelling platform.
With MAPOG, every pin becomes a window into your business — complete with images, metrics, and insights that build engagement and understanding.
In a world where attention is limited, interactive maps turn your operations into visual experiences — helping businesses not just inform, but connect.