Water scarcity continues to challenge many rural areas across India. With shifting climate patterns, population pressures, and the overuse of natural resources, numerous villages face both seasonal and long-term water stress. However, Mapping Groundwater Concentration through GIS presents a powerful approach to this issue. By visualizing the availability and distribution of subsurface water, it becomes easier to plan for water resource allocation for village needs. This spatial method not only highlights water-stressed zones but also pinpoints their proximity to viable water sources—enabling more targeted and sustainable water management strategies.
Key Concepts of Water-Scarce Village Mapping
To tackle water scarcity effectively, it’s crucial to grasp the foundational elements of GIS. This technology integrates geographic data, satellite imagery, and descriptive layers into an engaging, interactive format. Features like story maps play a pivotal role—they blend spatial tools such as buffer analysis with narrative text, visuals, and multimedia to communicate insights clearly. Whether you aim to create a map for analyzing water quality in rural regions or create a map for forest-water management in ecologically sensitive zones, GIS enables deeper spatial understanding and more impactful planning.
Step-by-Step Guide to Creating a GIS-Based Story Map
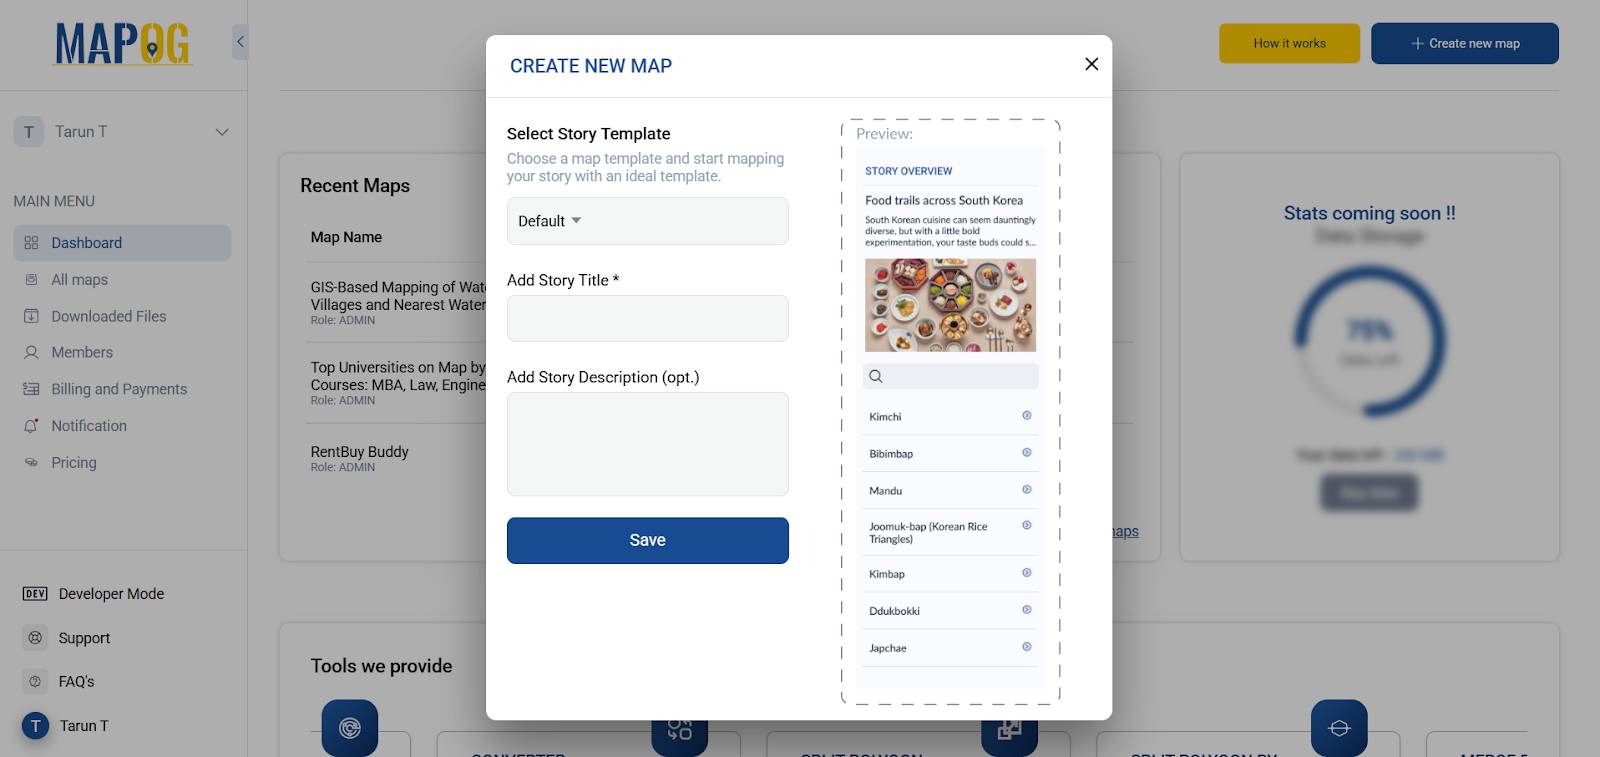
1. Click on “Create New” and start your Map journey
To begin, select the Create New option in MAPOG, and then add your ‘title’ and ‘description’ for the topic.
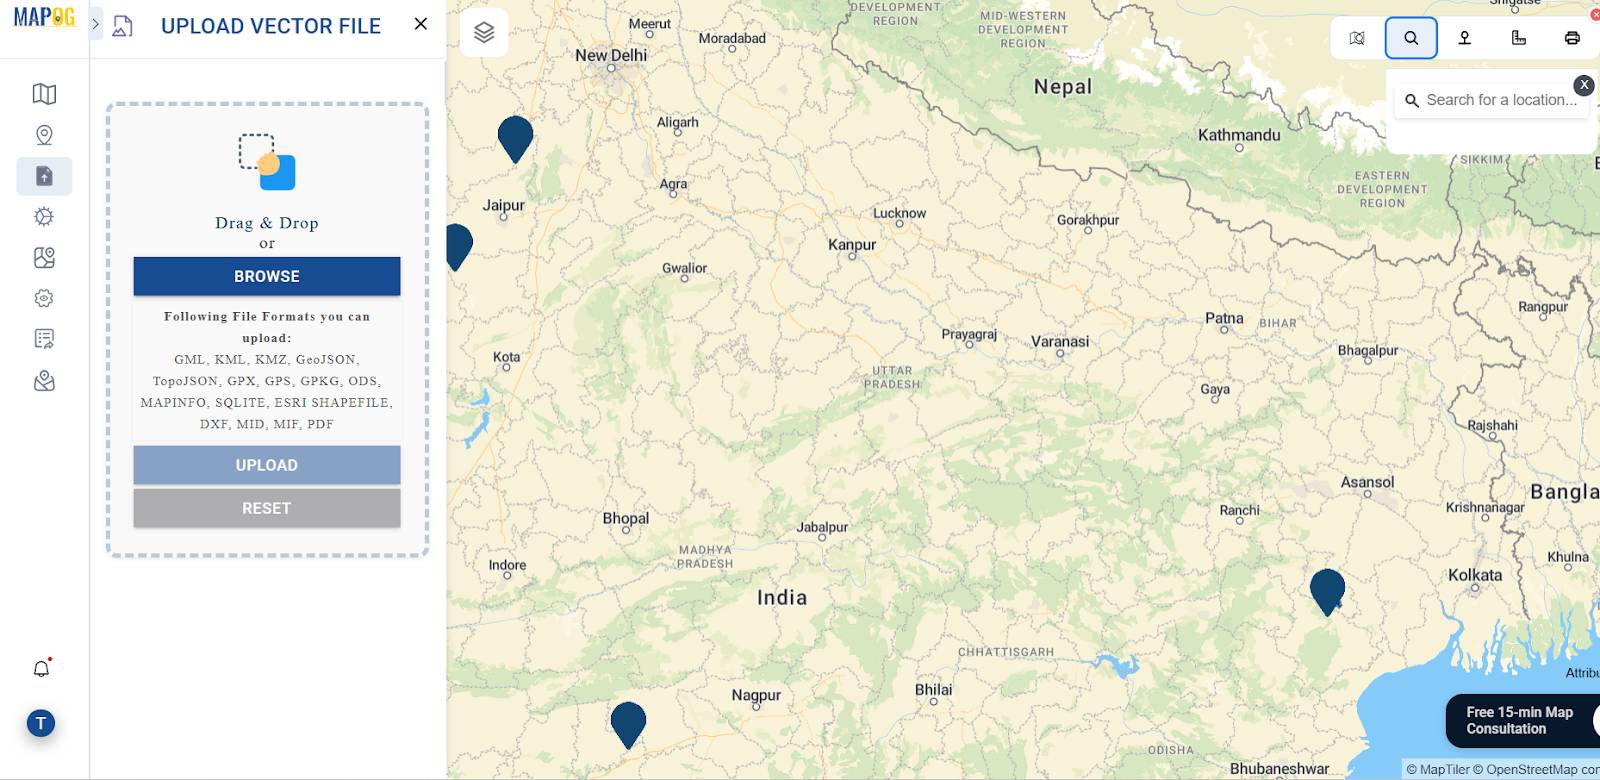
2. Upload GeoJSON Data for Mapping
Next, navigate to Add/Upload Data → Upload Vector File to import your village boundary or region of interest. Be sure the file is in GeoJSON format for compatibility.
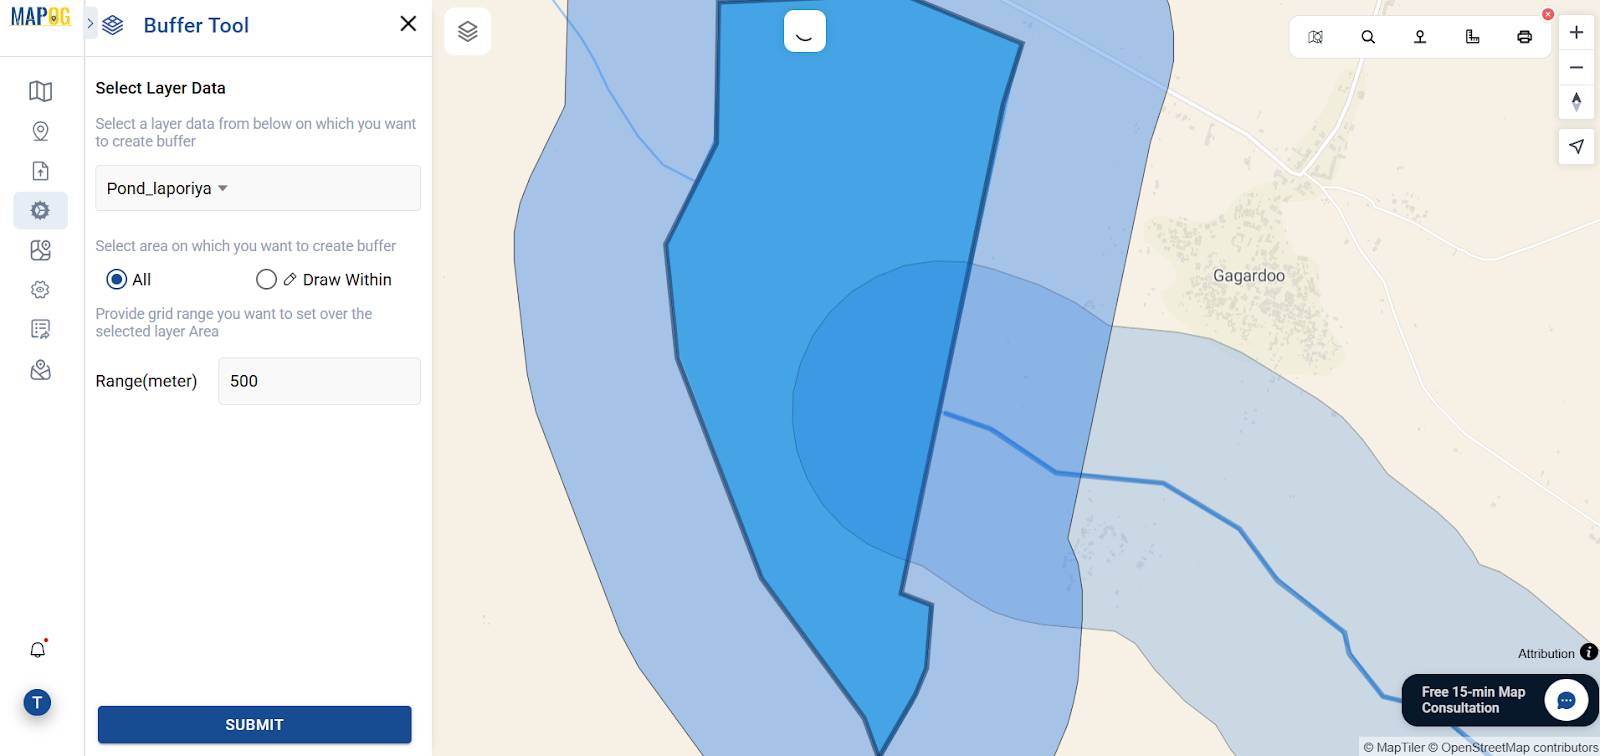
3. Create a 500 m Buffer Around the Water source’s
Then, use the buffer tool to define a 500 m radius around the nearest water sources. Consequently, this spatial zone, in turn, helps in identifying nearby water sources, infrastructure, or natural features which lie within an accessible distance.
4. Style Layers for Enhanced Visual Impact
Next, customize the appearance of each layer—for example, adjust colors, opacity, borders, and labels so as to differentiate between the village boundary, buffer zone, and water sources thereby making interpretation easier.

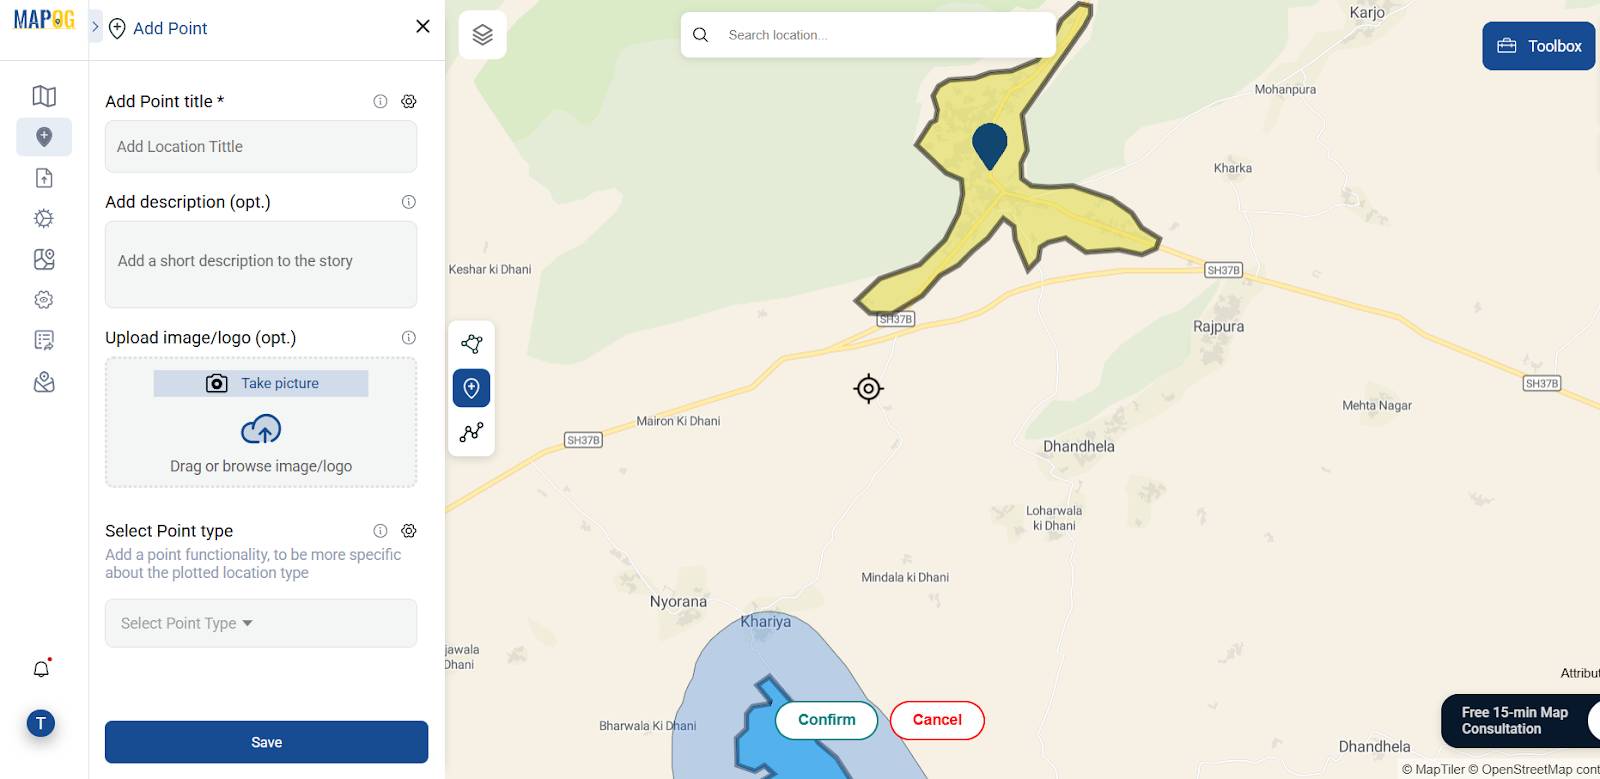
5. Add Descriptive Content and Media in the Story Section
In the “Add Story” panel, input essential information: the name of the village, a concise description of its water challenges (e.g., duration, intensity), and upload an image that visually represents the local context.
6. Preview, Publish, and Share Your Interactive Map
Finally, finalize your map by using the Preview and Share options. Then, publish the map and generate a shareable link or an embed code that you can integrate into websites or reports.

The Value of Water-Scarce Village Mapping in GIS Water Resource Management
GIS provides a comprehensive framework for visualizing and understanding water scarcity by linking physical geography with socio-environmental data. As a result, water-scarce village mapping using GIS enables planners, researchers, and governments to identify gaps, plan interventions, and prioritize resource allocation more effectively. Therefore, for water-scarce villages, this spatial insight is critical for sustainable development.

Beneficiaries and Industrial Applications of GIS Mapping
- In particular, government bodies use it for policy planning and intervention mapping.
- NGOs rely on it for identifying high-priority regions.
- Industries—especially agriculture, mining, and water supply—use GIS to manage water resources, minimize risk, and ensure operational continuity.
- Academia and research institutions adopt GIS to model climate impacts and hydrological cycles.
Final Thoughts on Water-Scarce Village Mapping for Sustainable Water Solutions
From water-scarce village mapping using GIS to identifying accessible water sources through buffer analysis, GIS turns complex water management challenges into actionable insights. With tools like MAPOG’s Add Story and Buffer features, even those without technical expertise can craft compelling, data-rich spatial stories. These visual narratives not only highlight water scarcity but also guide smarter infrastructure planning and resource allocation.
So, the next time you’re working to improve rural water access or planning sustainable interventions—let the maps lead the way.