With the rise of sustainable agriculture, organic farming meanwhile emerges as a key method for eco-friendly food production. However, its long-term success depends, above all, on precise site selection. Fortunately, with the help of a GIS Tool for Organic Farming, such as MAPOG, users can seamlessly adopt Smart Farming with GIS. Moreover, by seamlessly layering data—such as soil quality, rainfall distribution, and land use—MAPOG efficiently streamlines the process of pinpointing ideal locations for organic farming. Moreover, whether you’re focused on district-level irrigation planning or aiming to refine farm zones for maximum output, these tools offer unmatched spatial insight. This article helps you create a story map to identify and showcase top zones for sustainable farming.
Understanding the Concept using GIS Tool for Organic Farming
A GIS Tool for Organic Farming effectively visualizes spatial links between soil, rainfall, and crop history—thus enabling smarter, data-driven decisions for mapping zone with specific farming field.
Step-by-Step Guide: To Create map Using GIS Tool for Organic Farming
1. Start Your Story Map
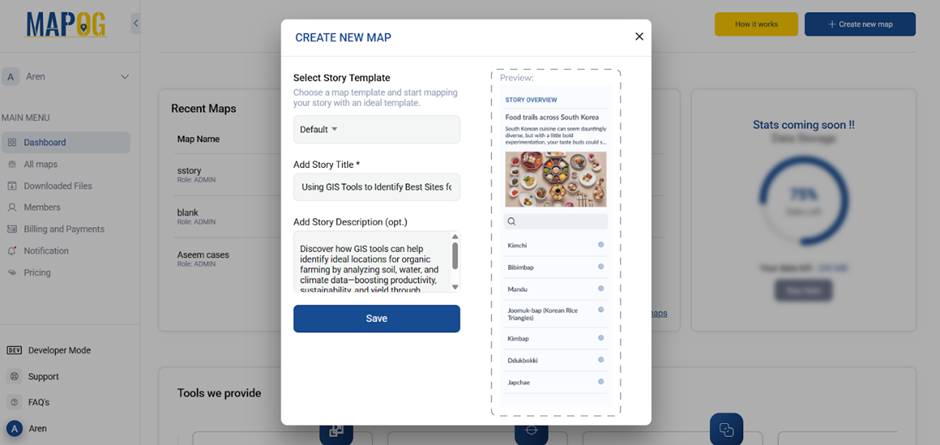
To get started, simply navigate to MAPOG, then click on “Create New.” After that, be sure to enter a compelling title, and additionally, include a concise yet informative description of your organic farming initiative to clearly set the project’s context.
2. Upload Relevant GIS Layers
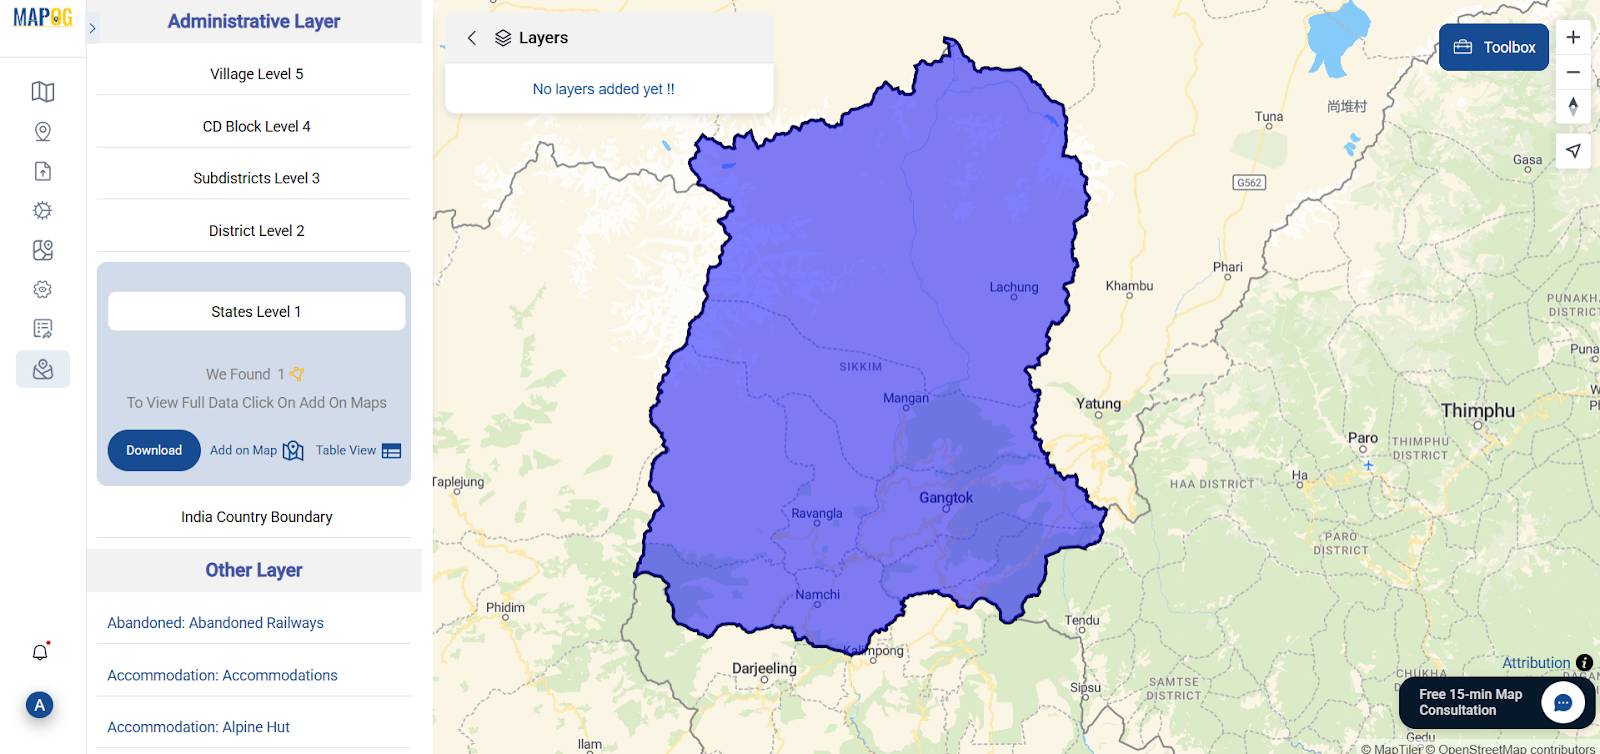
Then, under the GIS Data section, effortlessly add essential layers on map—such as state boundaries, rivers, roads, and residential zones—thereby establishing a well-defined and accurate study area.
3. Style Layers for Clarity
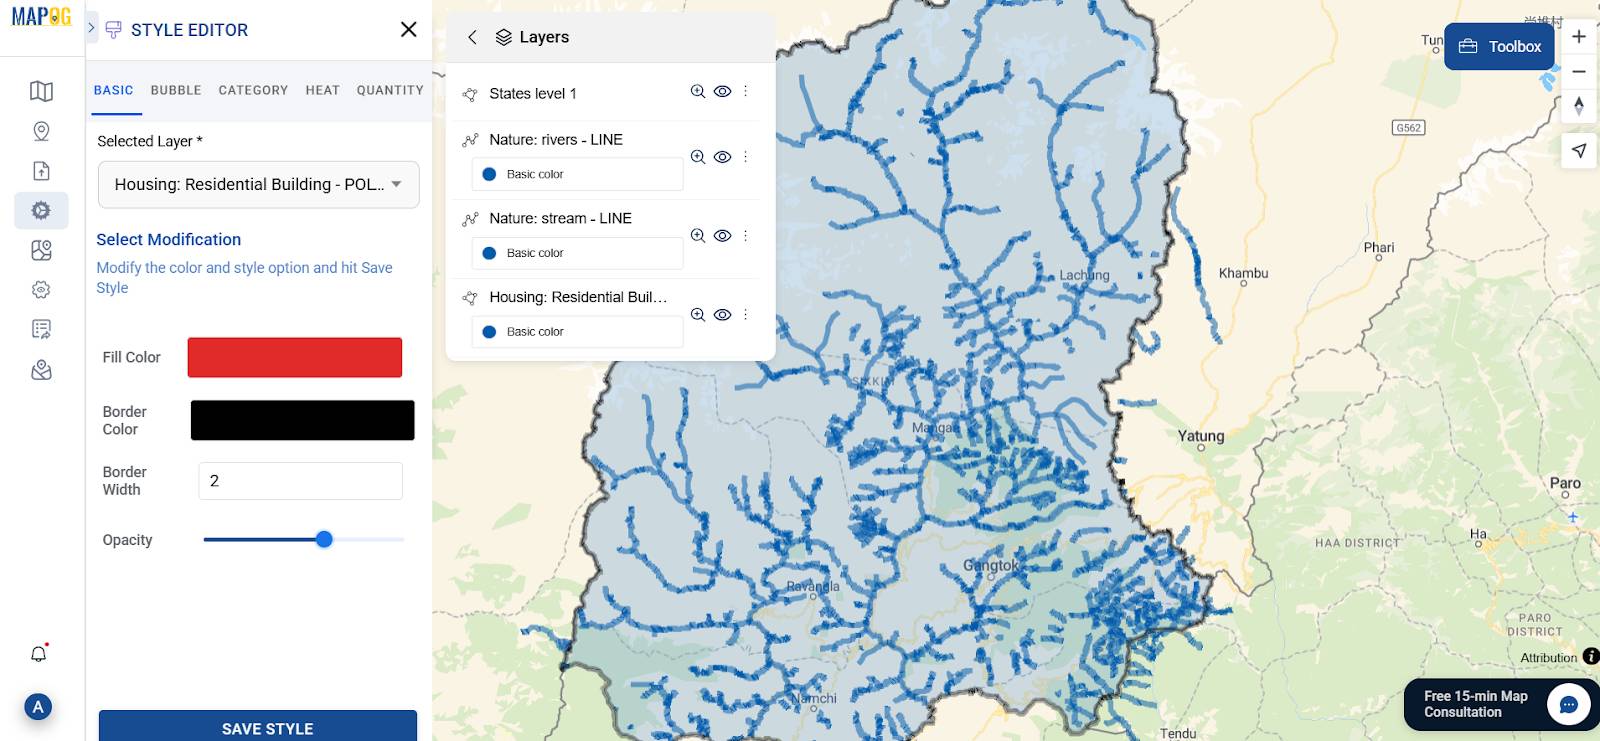
To enhance visual clarity, customize styles layer by adjusting symbols, labels, and colors—making your map both informative and visually engaging.
4. Run Buffer Analysis
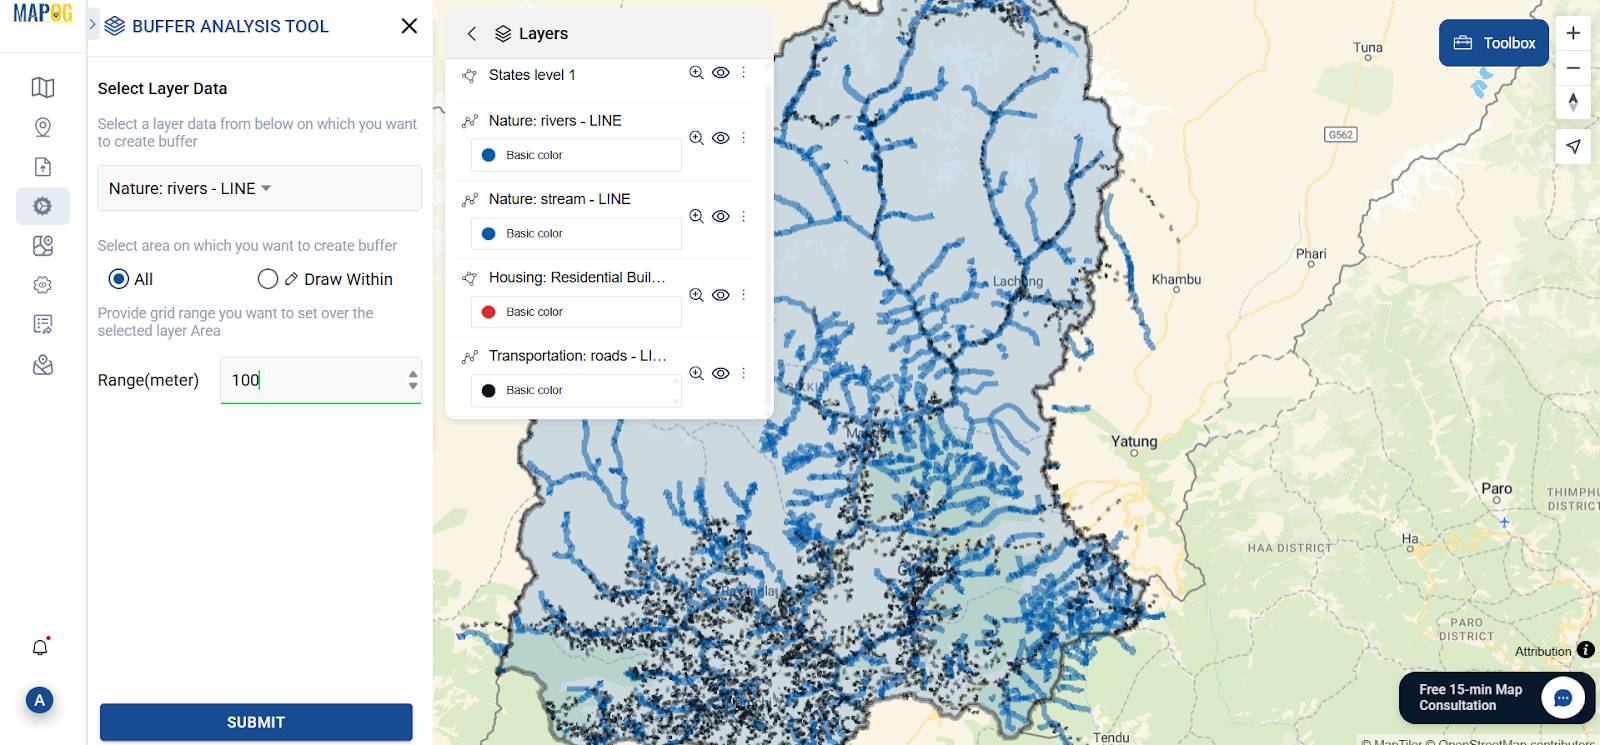
By applying the Buffer tool found in the Process Data module, I strategically created specific zones around each asset first by choosing the appropriate layer and then carefully setting defined buffer parameters.
- Roads – 50 meters
- Rivers – 100 meters
- Stream – 100 meters
- residential areas – 200 meters
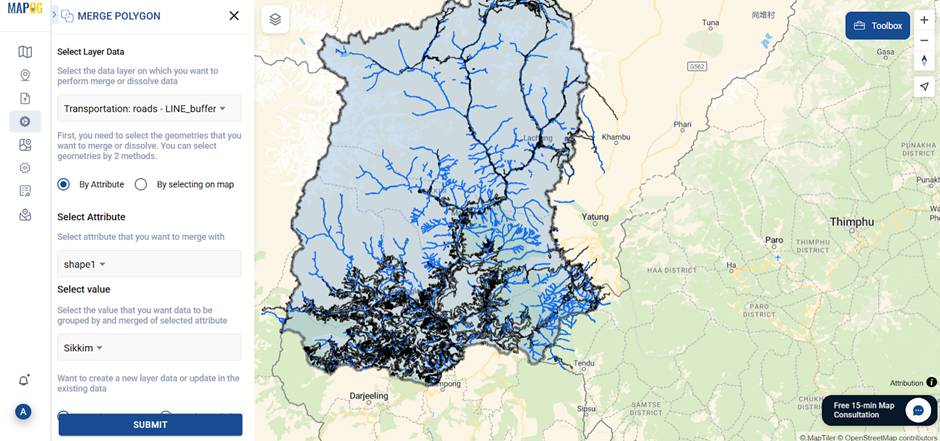
5. Merge Buffers for Better Insight
By utilizing the Merge Polygon tool in this case, I first supplied the road buffer layer, then seamlessly merged it using attributes, and ultimately saved it as a new layer—thus enhancing both decision-making and visual clarity.
6. Identify Opportunity Zones
To enhance both decision-making and visual clarity, I utilized the Merge Polygon tool, then supplied the road buffer layer, merged it through attribute selection, and saved it as a new layer.
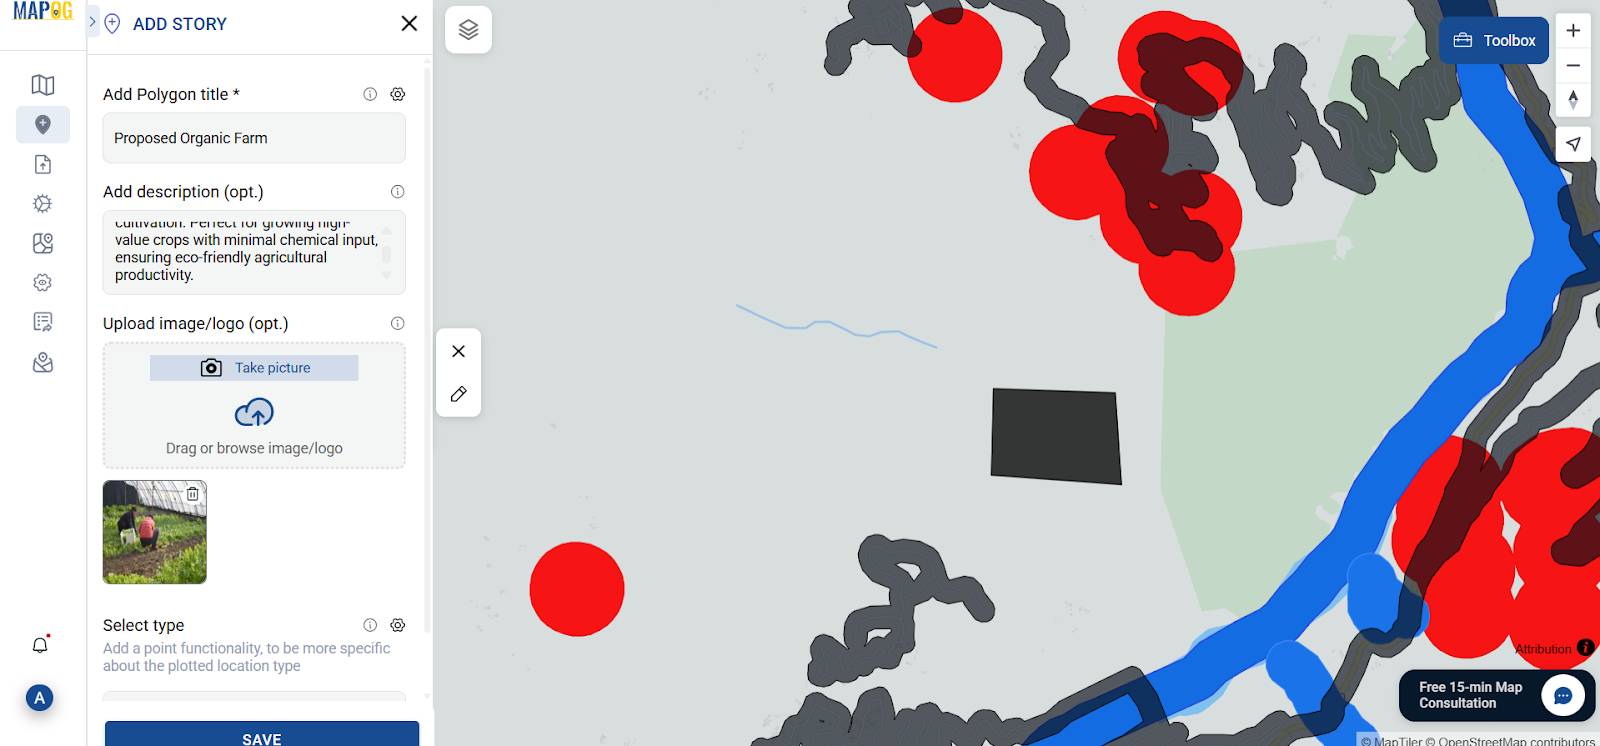
7. Create Polygon Layer for Farms
Afterward, using Add Story, simply outline your chosen area with polygons, then incorporate farming types, suitability insights, and visual references
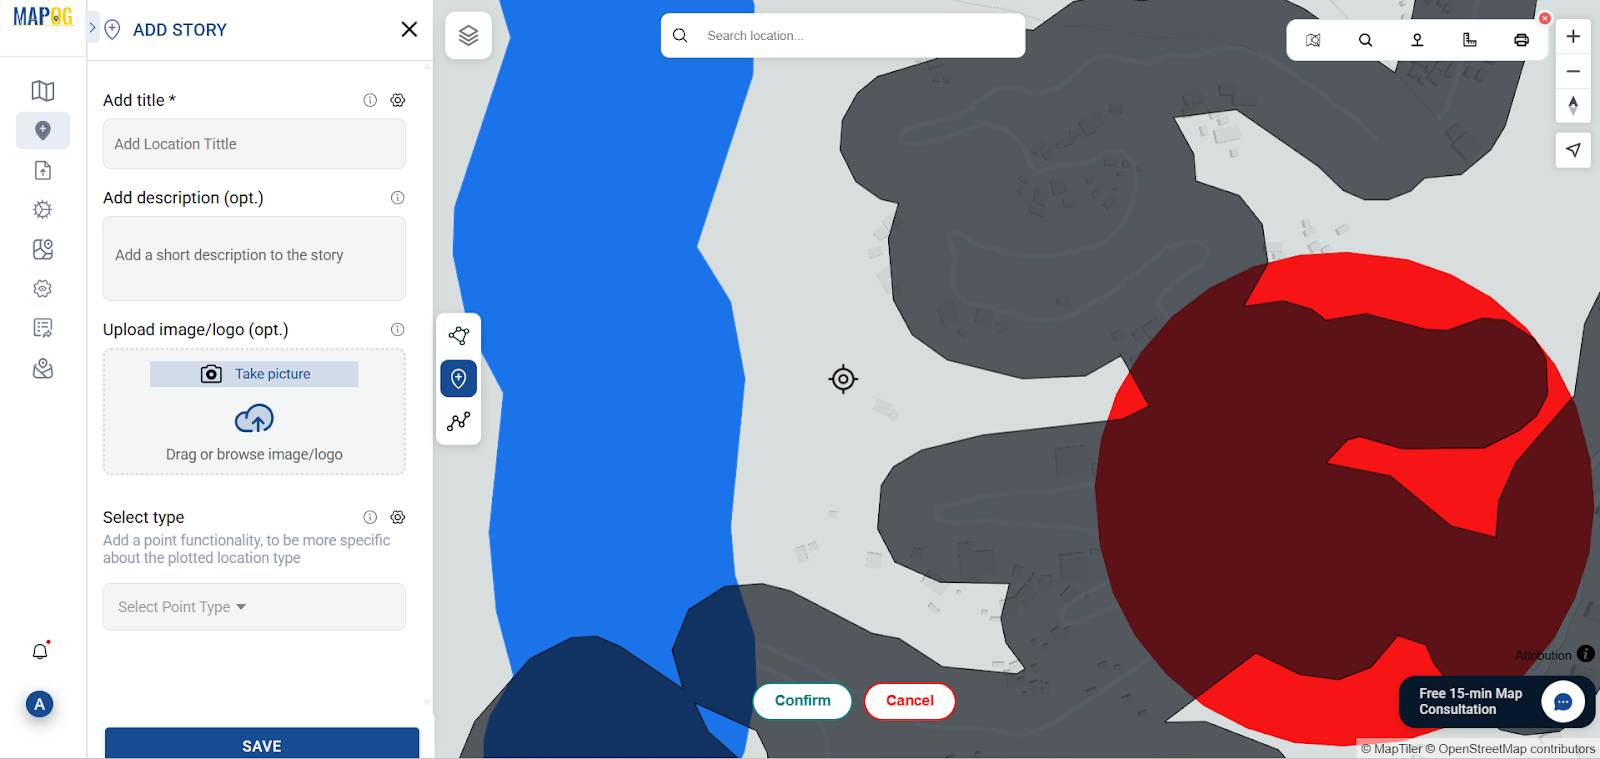
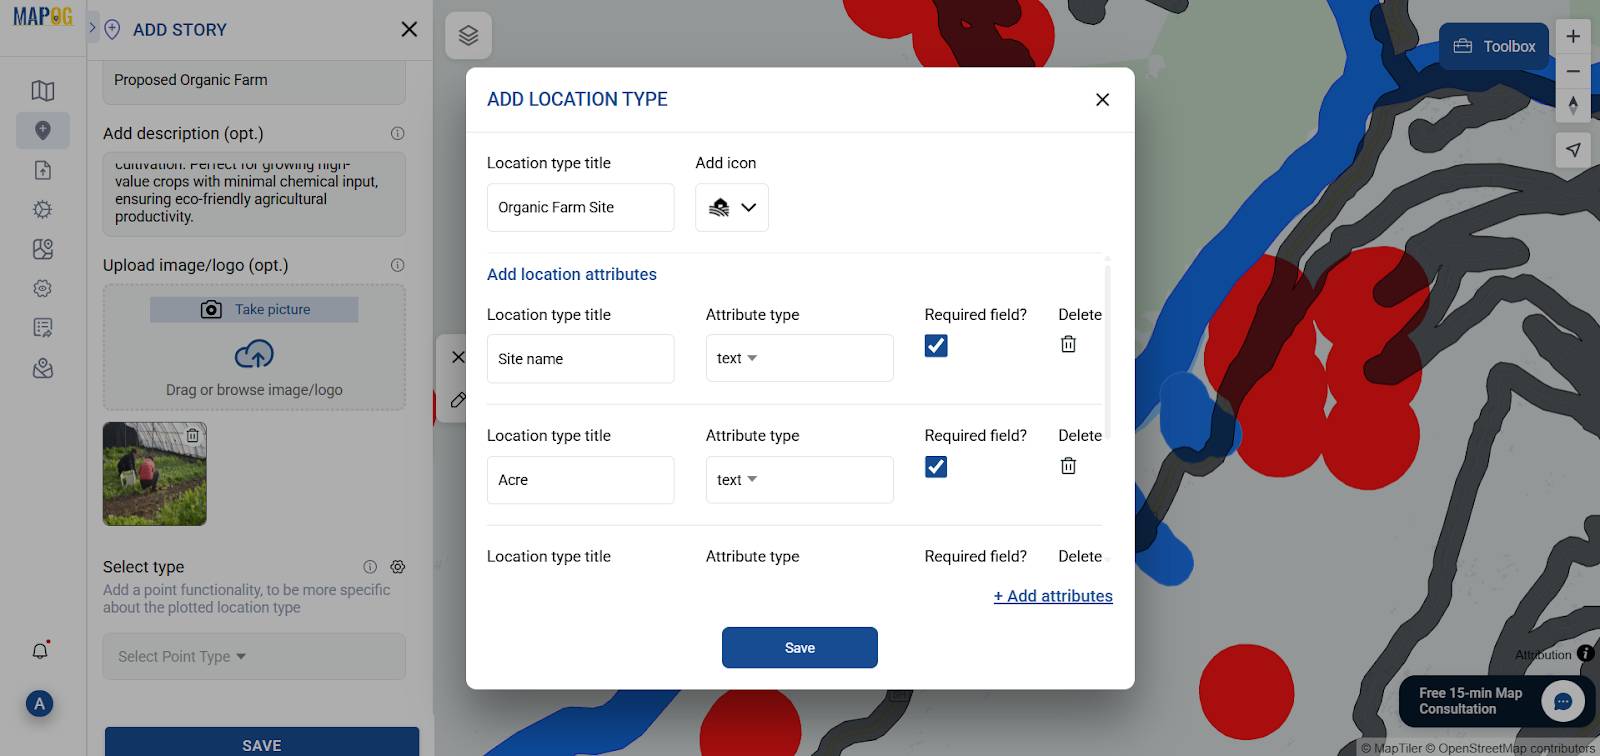
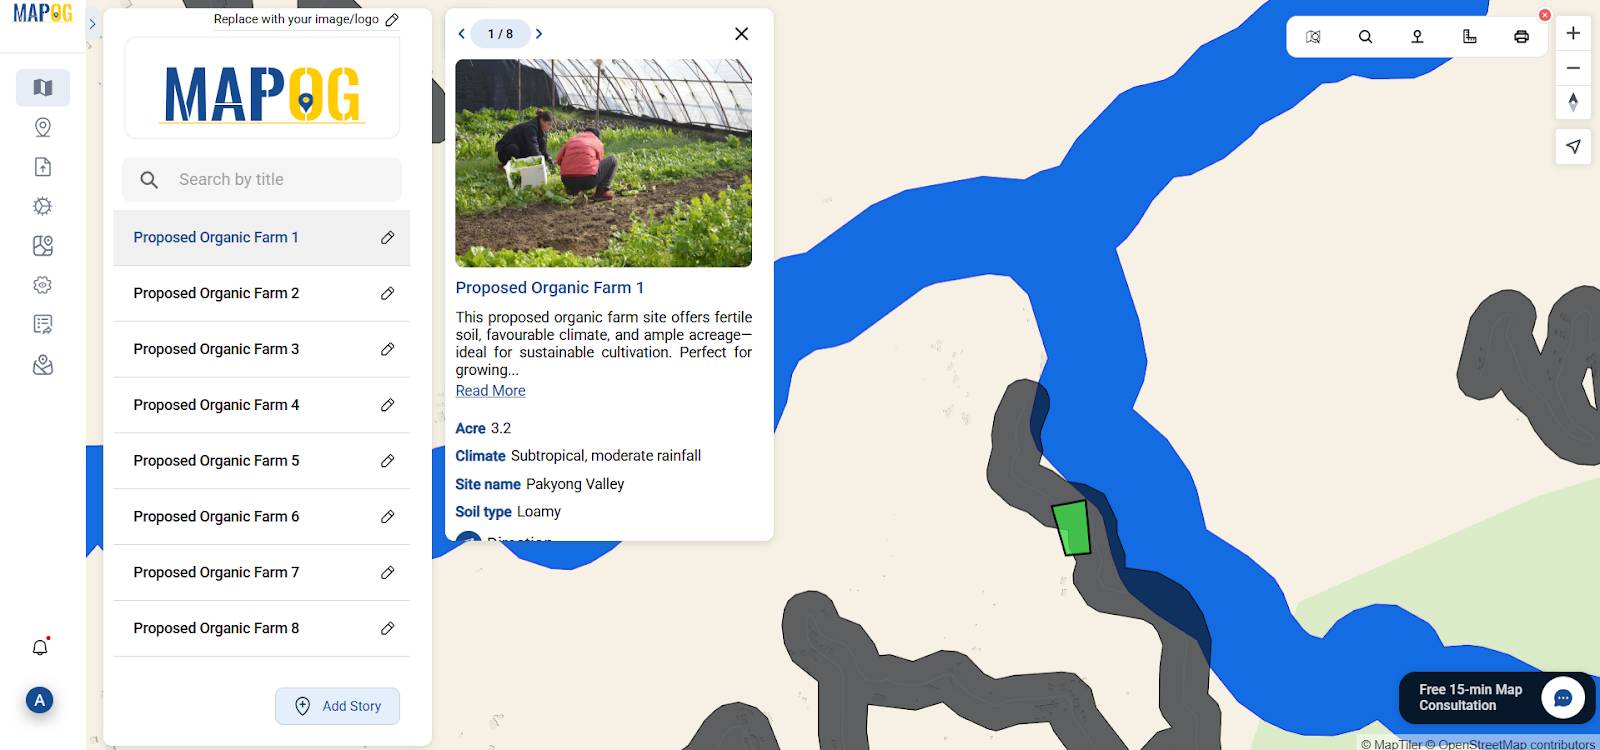
8. Add and Annotate Sites
Then, proceed to Select Type, assign the label ‘Organic Farms,’ and subsequently enter details like site name, acre , soil type, climate, and other specified attributes.
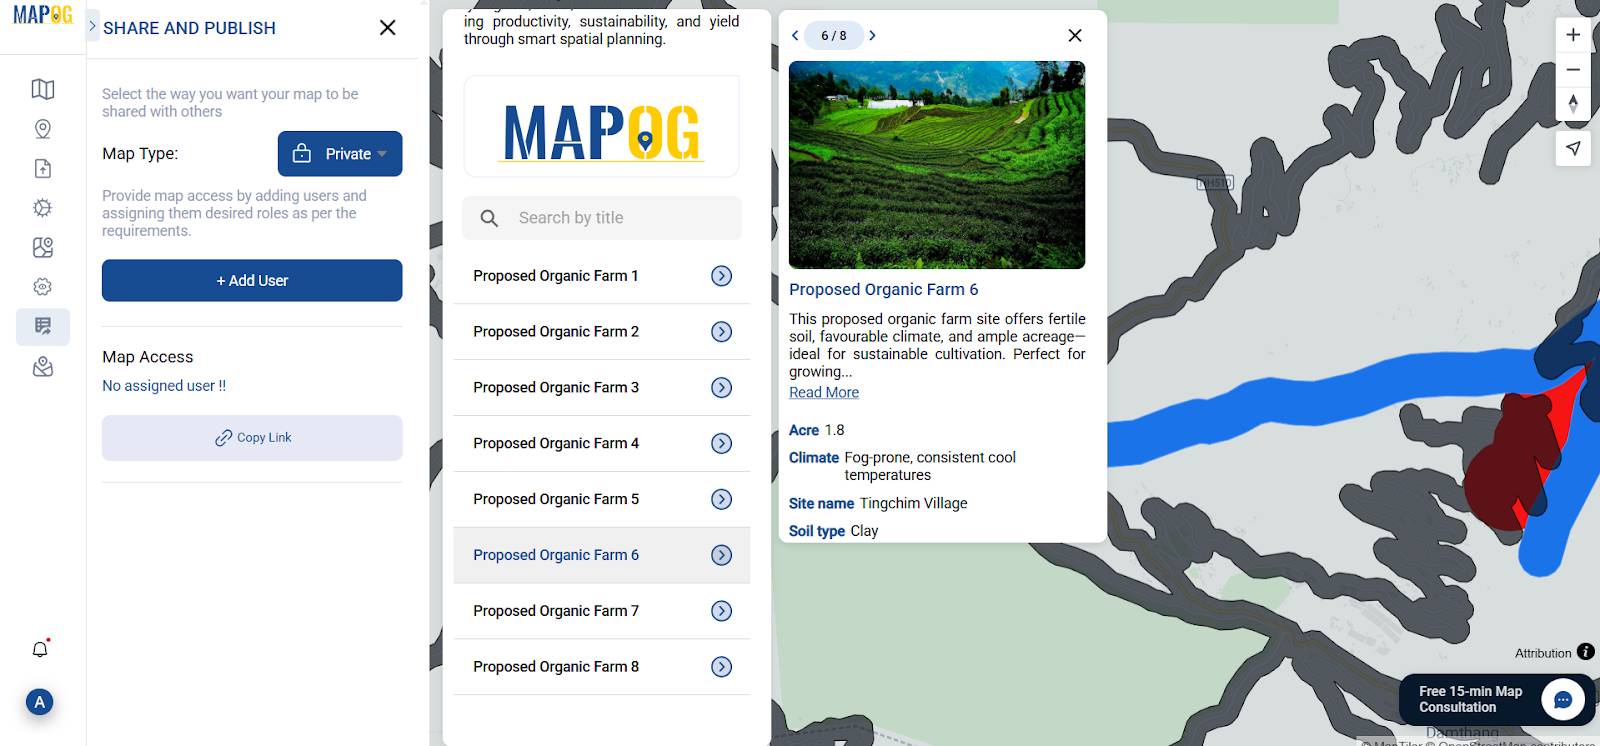
9. Share and Publish Your Map
Finally, click on Share & Preview to either generate a link or embed code, thereby ensuring your story map is easily accessible and shareable.
Why GIS is a Game-Changer in Organic Farming
By seamlessly integrating various environmental datasets, GIS tools provide a unified view, thus enabling in-depth analysis of agricultural potential. Consequently, they pinpoint areas with rich organic carbon, favourable rainfall, and pest-resilient conditions—ultimately enhancing yield while minimising guesswork.
Industries Benefiting from GIS-Driven Organic Insights
- Agriculture and Horticulture Departments – For crop planning and resource use.
- Environmental NGOs: To promote sustainable land use.
- Organic Certification Agencies: To validate and trace farm origins.
- Policy Makers: For data-backed zoning regulations and subsidies.
GIS Data Used
- State level 1
- Nature river line
- Nature stream line
- Housing residential buildings
- Transportation Roads
Final Thoughts: Publish with Purpose
To broaden your impact, simply embed your interactive story map in a WordPress blog. Not only does this facilitate broader knowledge sharing, but it also showcases the real-world value of GIS in sustainable agriculture. Meanwhile, MAPOG simplifies spatial analysis—allowing users to interpret soil quality, water availability, and land suitability. Consequently, by merging geospatial intelligence with organic practices, it empowers data-driven decisions and enables efficient site selection across diverse terrains.