Identifying Flood Prone region near rivers is vital for disaster preparedness. Using GIS buffer analysis, a 1 km zone around rivers highlights vulnerable settlements, enabling rapid flood-risk estimation, mapping of exposed regions, and informed mitigation planning without complex hydrological modeling.
So users can build interactive flood risk maps by integrating river data, and key land-use layers like residential zones.
Key Concept: Identifying Flood Prone region
- Rivers often pose seasonal flood risks, especially in low-lying or encroached areas.
- Along with by applying a 1 km buffer around river layers and using advanced filtering, planners can rapidly assess.
- Identifies flood-prone residential zones, safe areas, and supports mapping evacuation routes, relief centers, and zoning plans.
Uses of Identifying Flood Prone region
- Strengthens GIS skills for students, disaster managers, and planners using buffer-based hazard mapping.
- Supports flood mitigation, evacuation planning, and safe site identification.
- Connects academic GIS exercises with real-world climate resilience needs.
Methodology: Identifying Flood Prone region
Project Focus: Identifying flood-exposed residential areas near rivers using buffer and advanced filter tools in MAPOG.
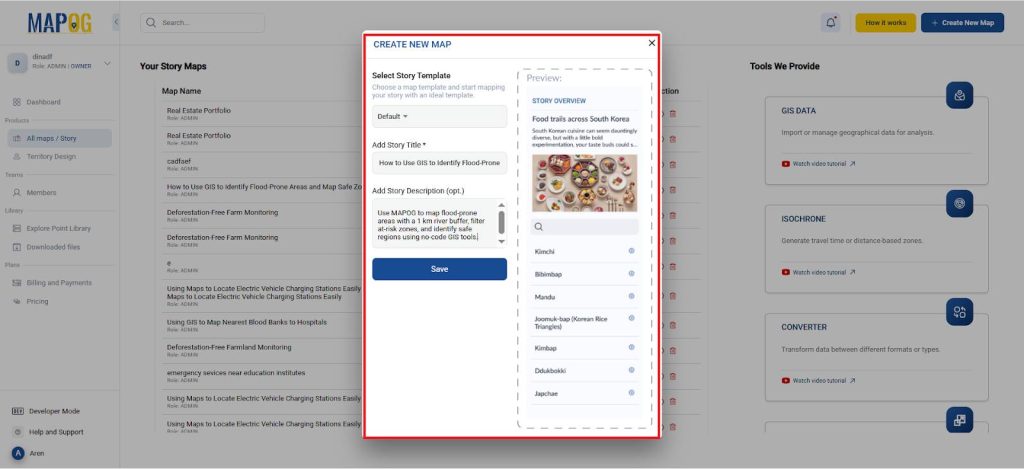
1. Start a New Project and Add a Title
- At first, go to the MAPOG website and click “Create New Map”.
- Assign a project name (e.g., Flood Risk Mapping) and enter a short description.
2. Upload and Add Layers
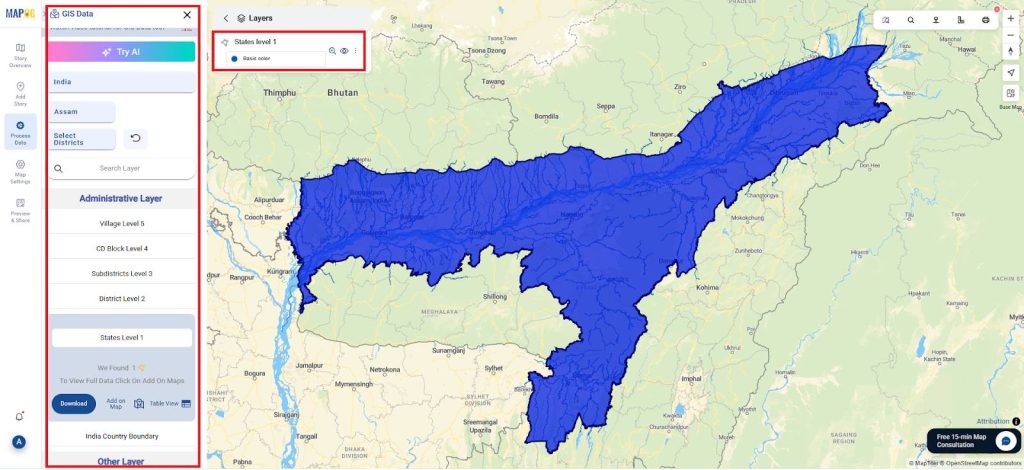
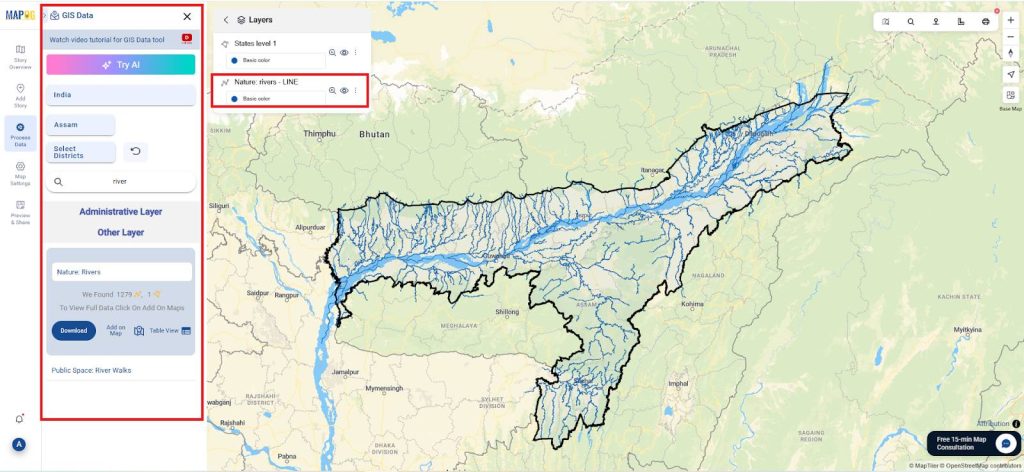
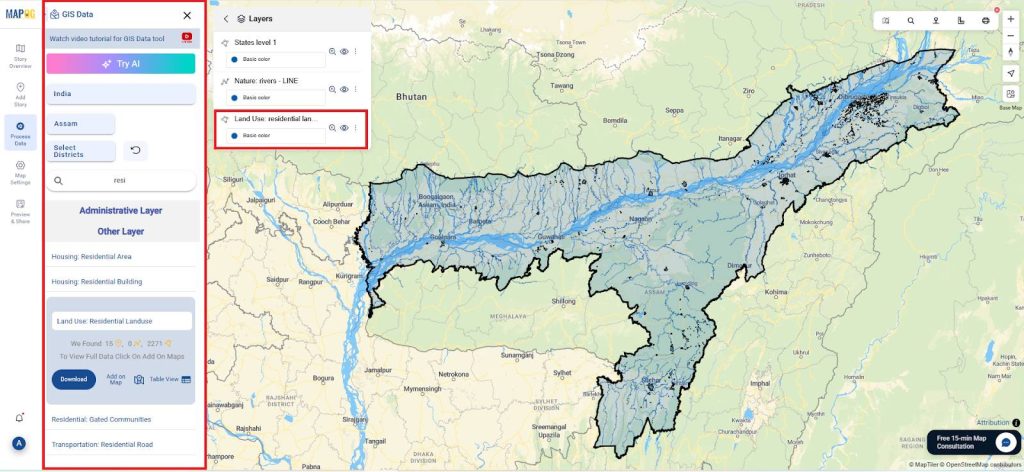
In Process Data, select GIS Data Library and add the following layers:
- District boundary layer : Country >> State >> State level 2
- Additionally, River layer: Country >> State >> Nature: River
- Similarly, Residential layer >> State >> Land Use: residential land use
3. Create Buffer Zone for Flood-Prone River Areas
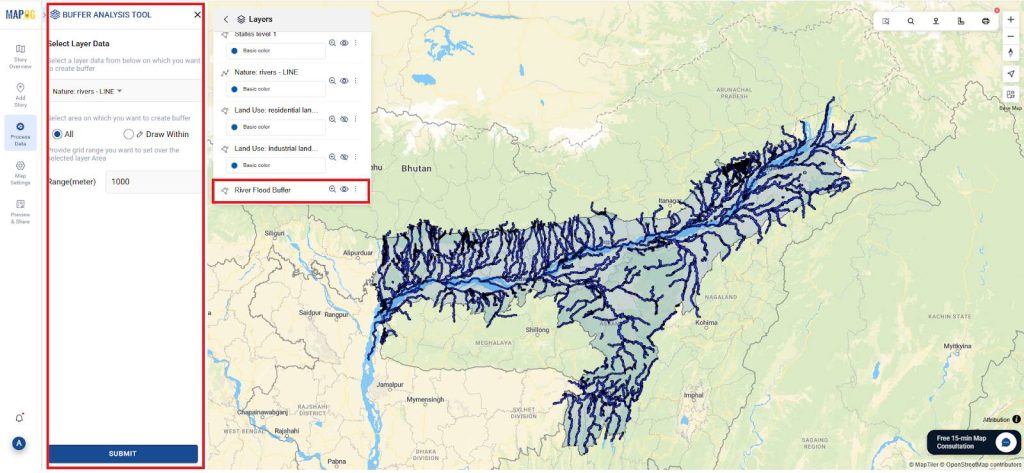
- Go to Process Data → select Buffer Analysis Tool.
- So, choose the River Layer as the input and assign a 1 km buffer radius.
- Additionally, rename this output layer as “River Flood Buffer“.
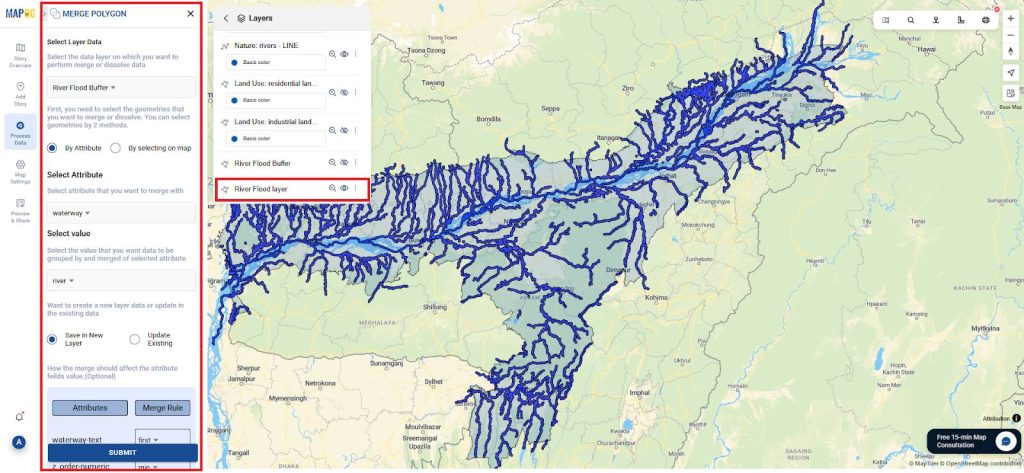
- Additionally, go to Process Data → select Merge Polygon.
- So, choose the river flood buffer as the input and merge by attribute and attribute as waterway and value as river.
- But save it as a new layer and rename this output layer as “River Flood layer“.
4. Filter Layers Within the Buffer
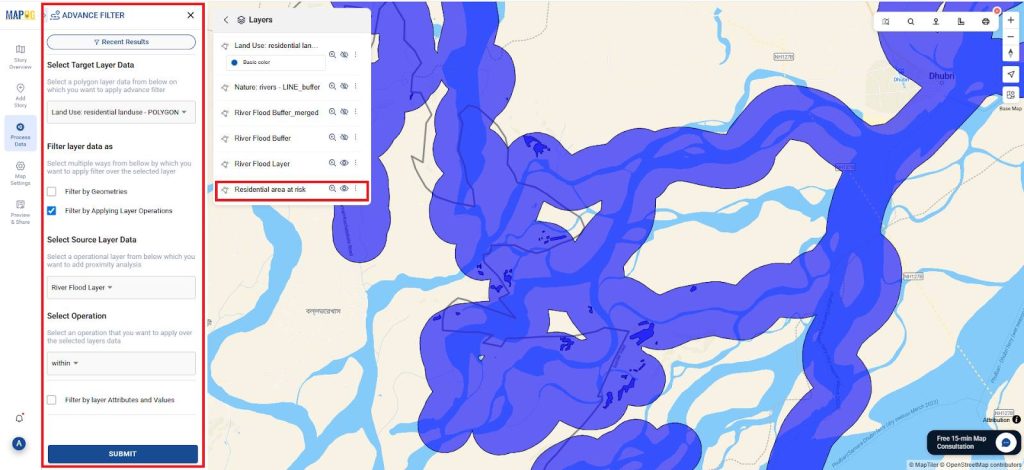
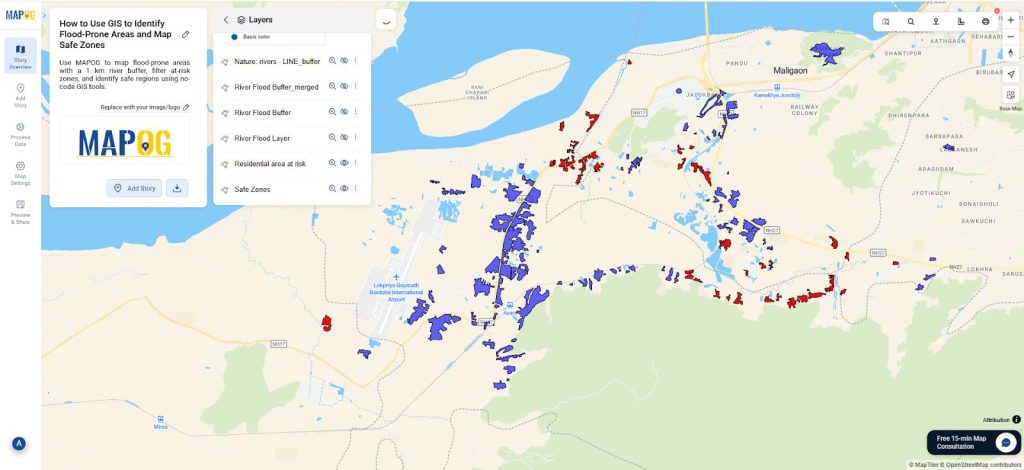
- Use the Advanced Filter Tool from process data to crop features from: Residential layer within 1 km buffer
- So, this will extract flood-risk zones from and use types.
- Moreover, give the target layer as landuse: Residential and select filter by applying layer operations. Select source as River flood layer (Merged layer) and operation as Within, then submit and Style the output layer.
5. Identify Safe Zones
- Use spatial comparison to locate residential areas that lie outside the river buffer.
- Then use the Advanced Filter Tool from process data to crop a safe Residential layer.
- Finally, give the target layer as landuse: Residential and select filter by applying layer operations select source as River flood layer (Merged layer) and operation as Outside and Style the output layer.
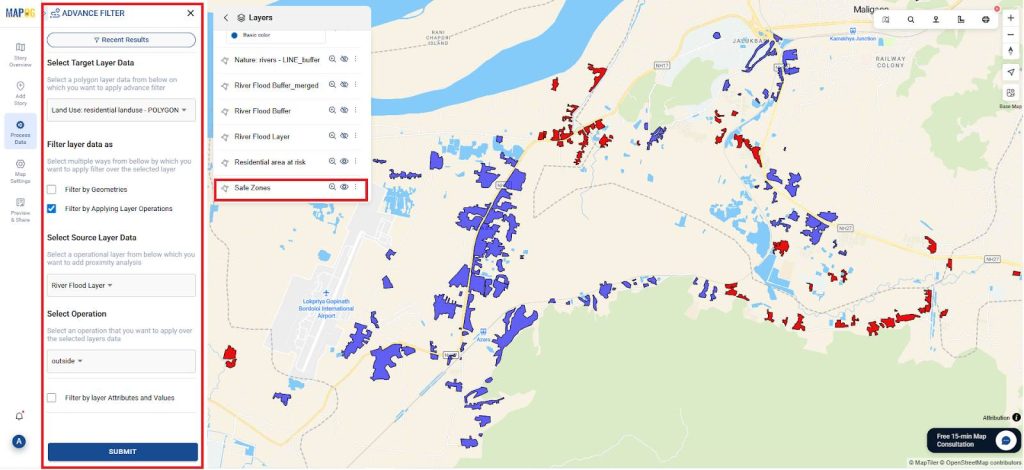
- Although this can be labeled as “Safe Zones” and styled in a separate color scheme for clarity.
6. Publish and Share the Map
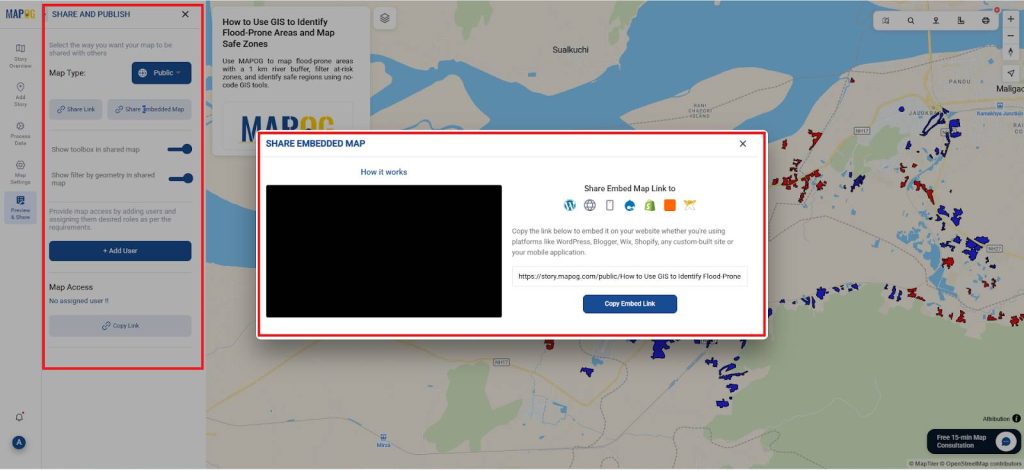
- Finally use MAPOG’s “Publish & Share” option to generate a live link or embed code.
- Then create a public-facing disaster risk map that supports planning, awareness, and training use cases.
Data Used
Insights and Applications
This flood exposure analysis helps:
- Pinpoint vulnerable neighbourhoods or industries for preparedness.
- Highlight safe areas for relocation or planning.
- Support zoning laws to avoid high-risk construction.
- Enable NGOs, disaster teams, and students to create real-time hazard maps.
Relevance Across Disciplines
Therefore, this GIS-based approach supports diverse fields like:
- Disaster Management
- Urban Planning
- Environmental Geography
- Public Safety and Risk Communication
further, it also fosters collaboration between learners, planners, and civic authorities.
Conclusion
As a result, Buffer-based flood mapping in MAPOG empowers users with fast, actionable insight into flood-prone areas. Several disaster planning case studies have successfully applied this method using MAPOG.
- Role of GIS In Irrigation Planning and Water Resource Management
- How GIS and Smart Mapping Reduce Urban Heat Islands
- GIS in Infrastructure Development and Road Network Analysis
- Flood Risk Mapping with Interactive Web Maps: SaaS Approach
- Optimizing Warehouse Location Selection with GIS for Supply Chain Efficiency