GIS in irrigation has become a cornerstone of sustainable agriculture, particularly in the face of increasing water scarcity and climate variability. In this context, one of the most powerful tools that enables farmers and planners to optimize water resources. By combining spatial data with advanced mapping techniques, GIS not only helps farmers manage irrigation more effectively but also significantly reduces water waste. Therefore, it serves as an essential technology for promoting resource efficiency and resilience in agricultural practices.
Key Concepts in GIS Monitoring for Irrigation
In order to apply GIS well in irrigation, know these key concepts:
- Data Integration: By combining layers, users gain insight.
- Flood Risk Mapping: Moreover, spotting flood-prone areas protects assets.
- Drainage Network Extraction: Similarly, mapping drainage optimizes irrigation.
- Climate Variability: Likewise, tracking weather guides planning.
How to Create a Map Using MAPOG
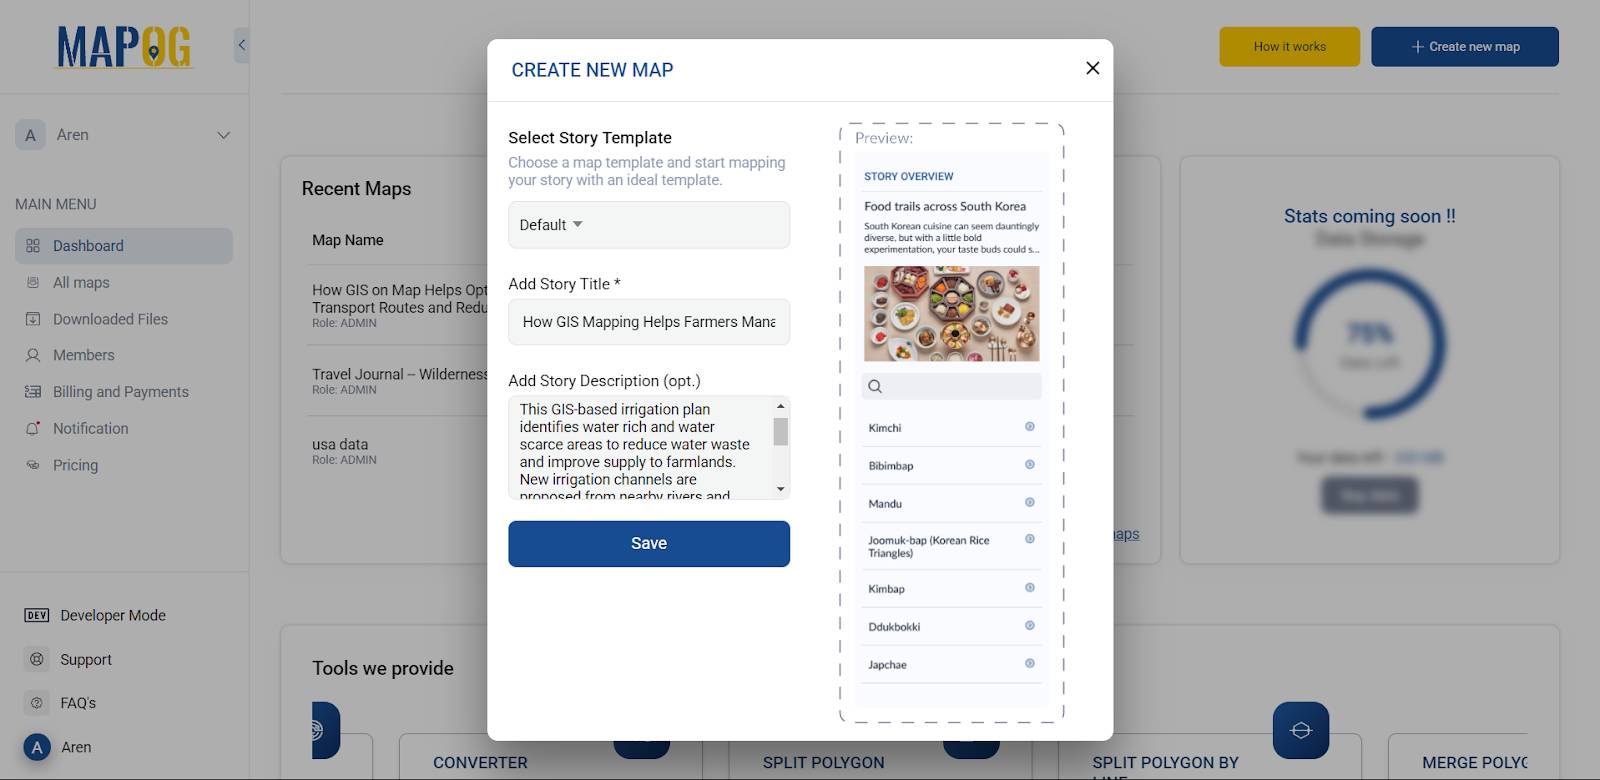
Step 1: Create a New Map
Go to MAPOG.
- Click “Create new map.”
- Add a title and description.
- Click Save to proceed.
Step 2: Gather and Upload Data
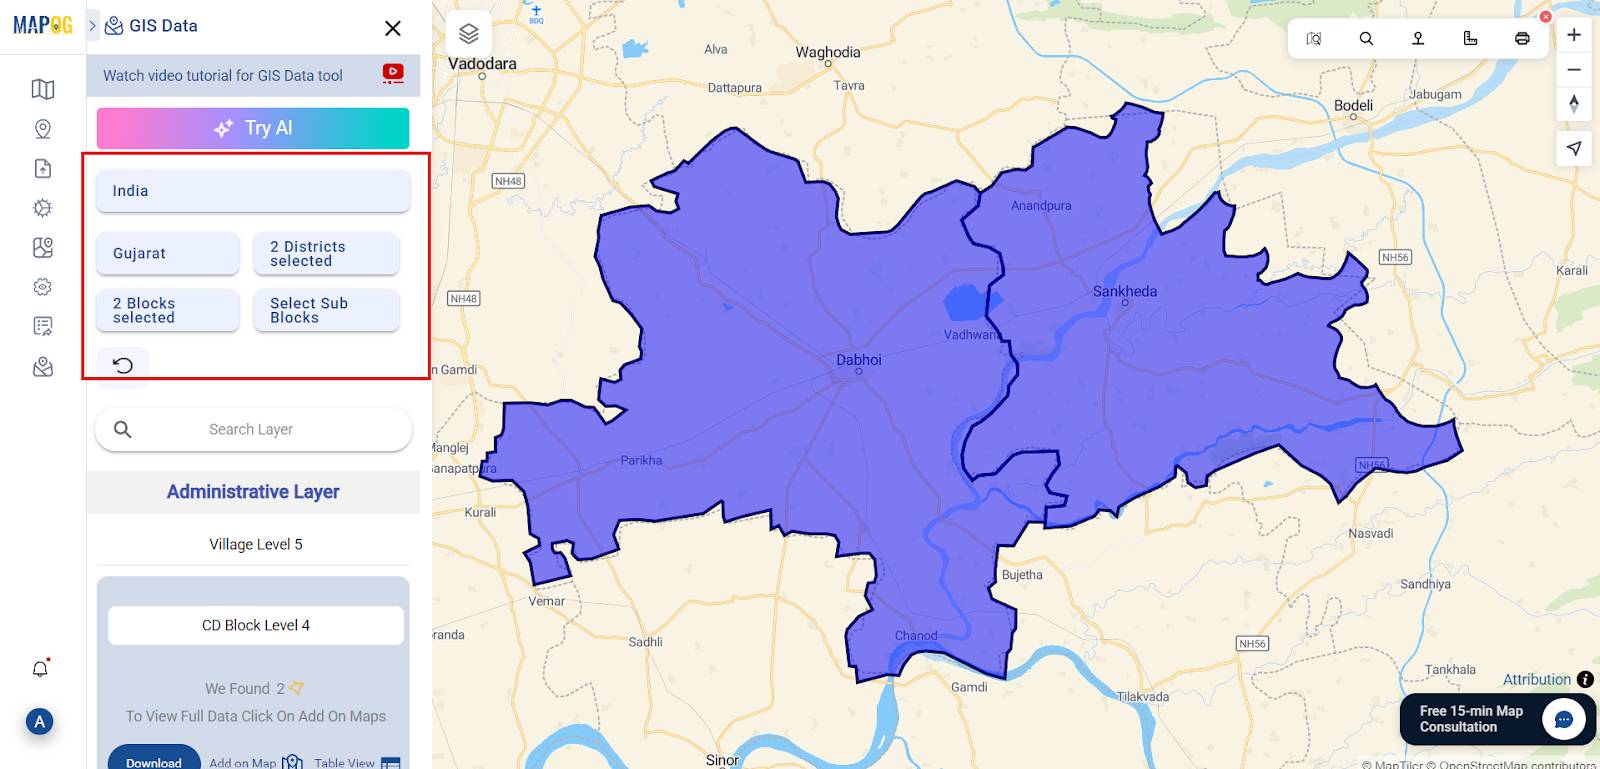
Navigate to the GIS Data section.
- Start by adding your location and Area of Interest.
- Zoom in to explore rivers, farmlands, infrastructure, and district boundaries.
- Click Add to map for each dataset.
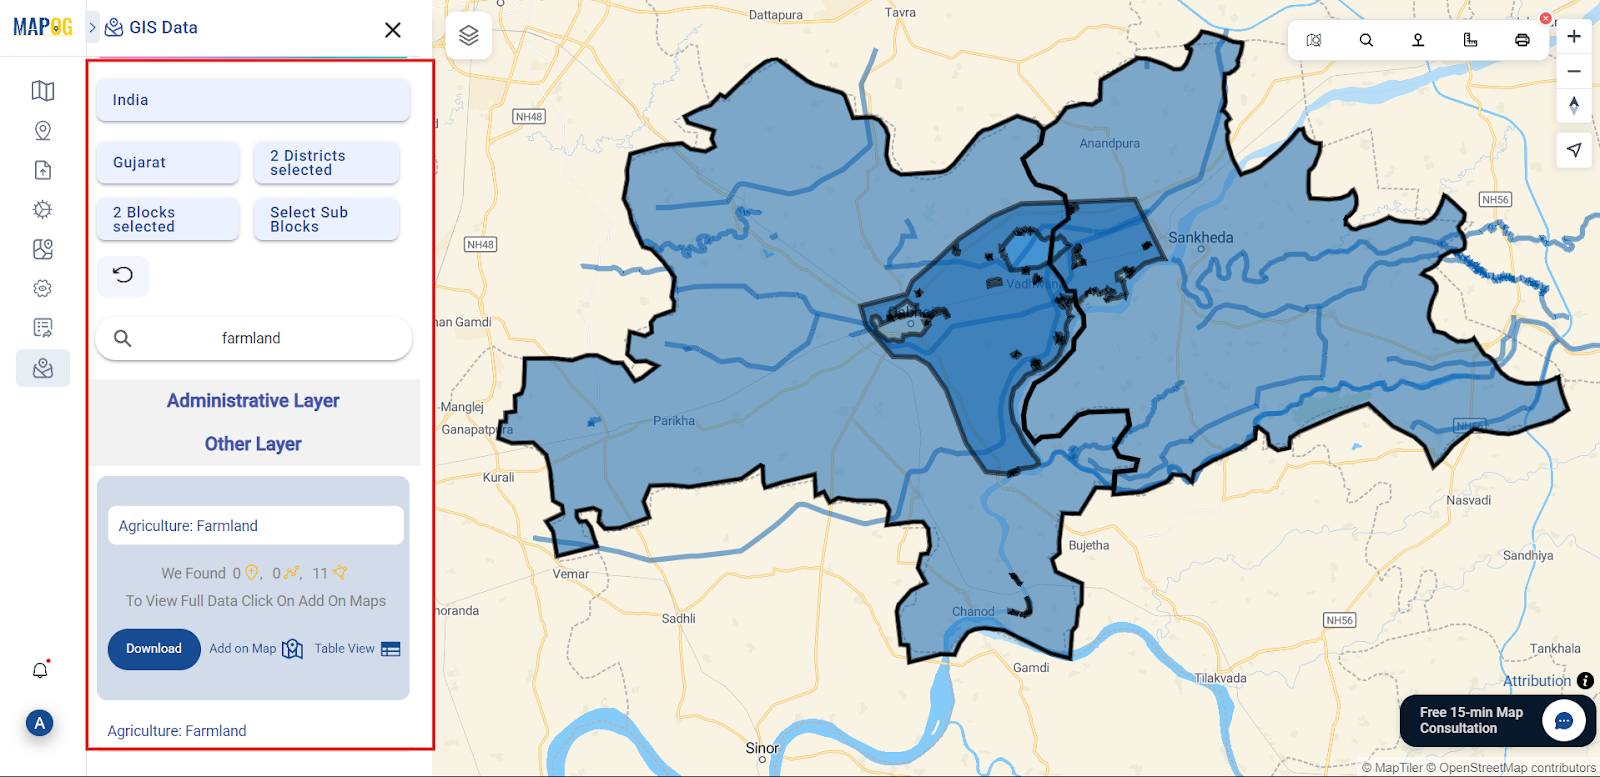
- Add Data to your Area of Interest
Click “Add Layer”
Enable Layers like:
- River data – Nature rivers Line
- Canal data – Irrigation Canal
- Farmland data – Agriculture Farmland
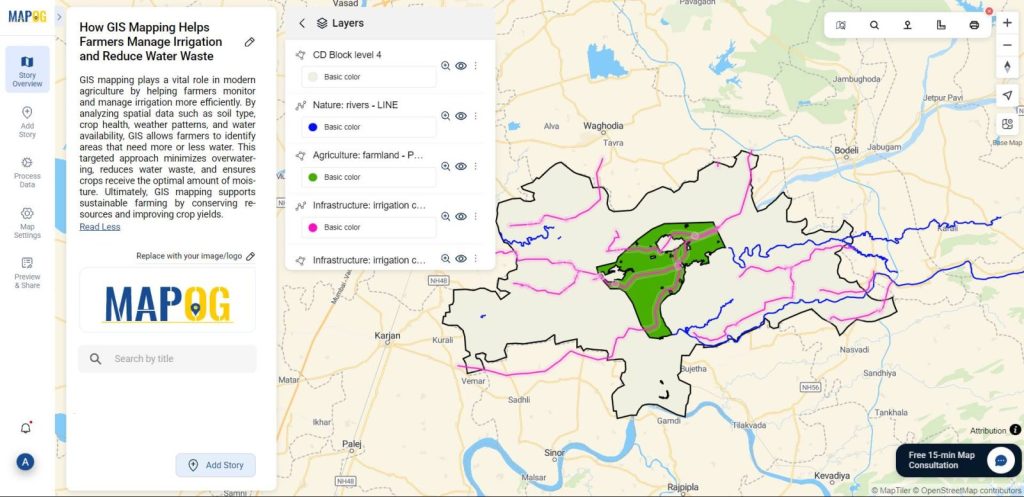
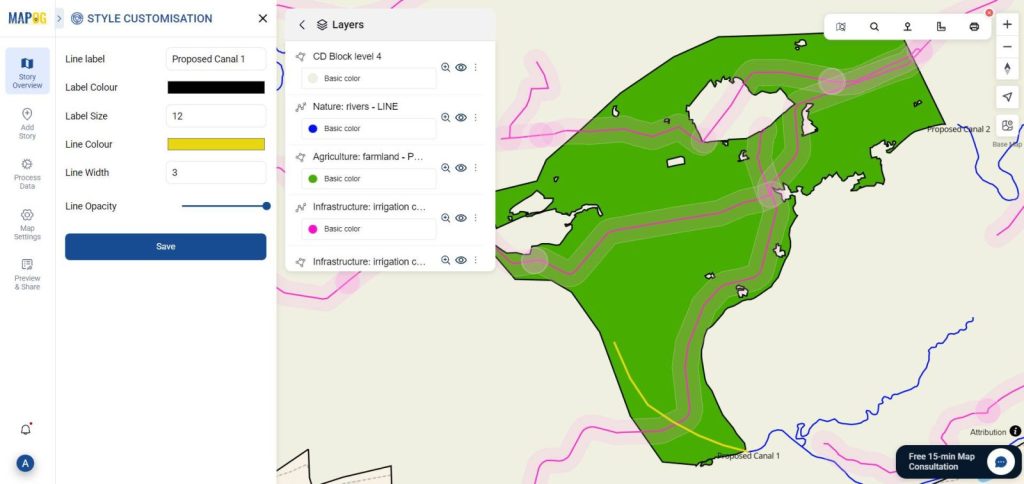
Step 3. Style Your Layers
- Go to the Layer section.
- Click the three dots icon next to any layer.
- Select “Style layer”.
Modify parameters such as: Line size, Opacity, Color
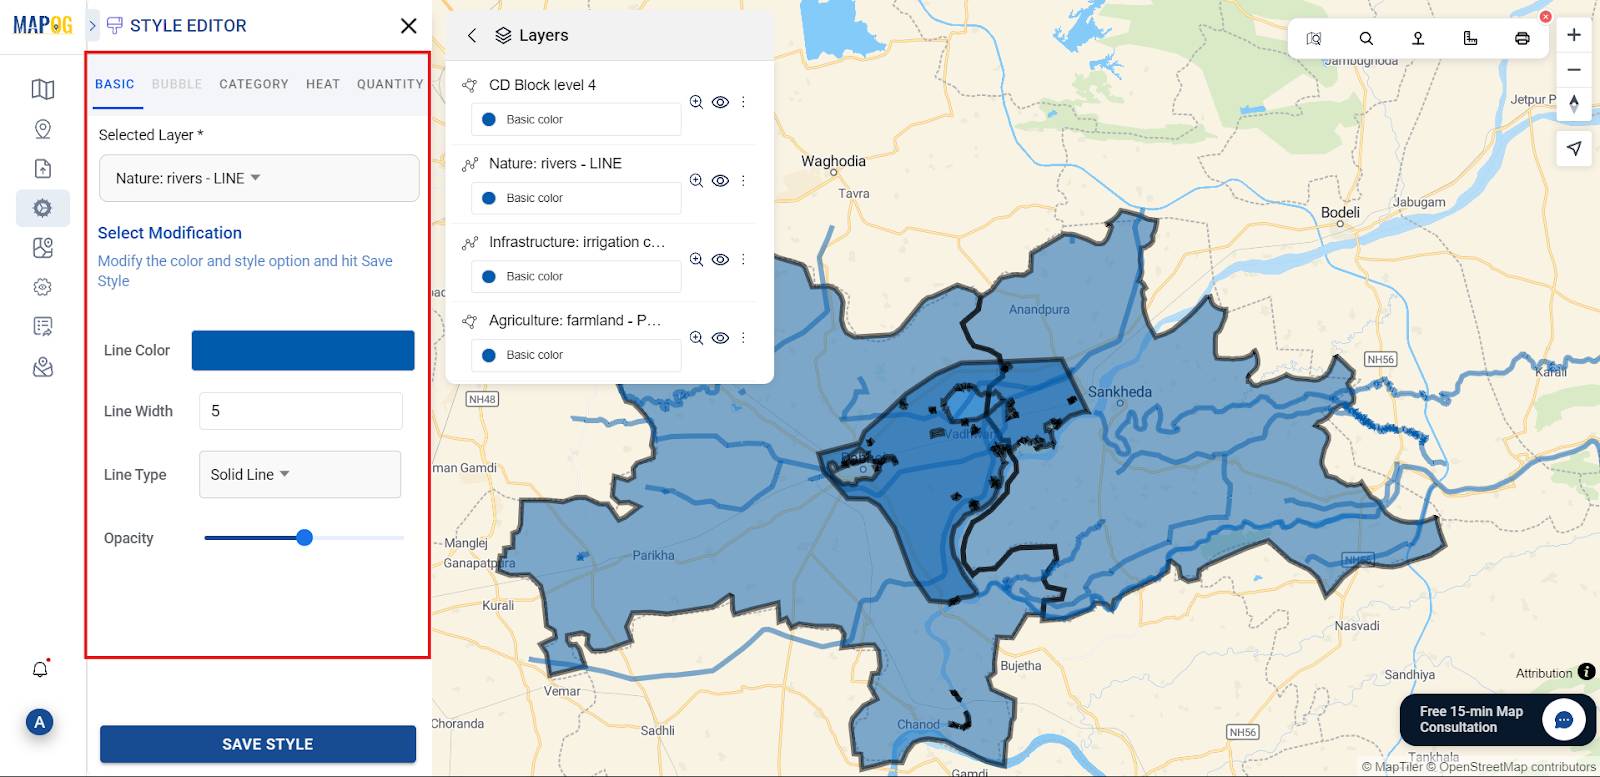
By assigning different colors to different layers, this visual separation therefore makes analysis easier.
Step 4. Perform Buffer Analysis
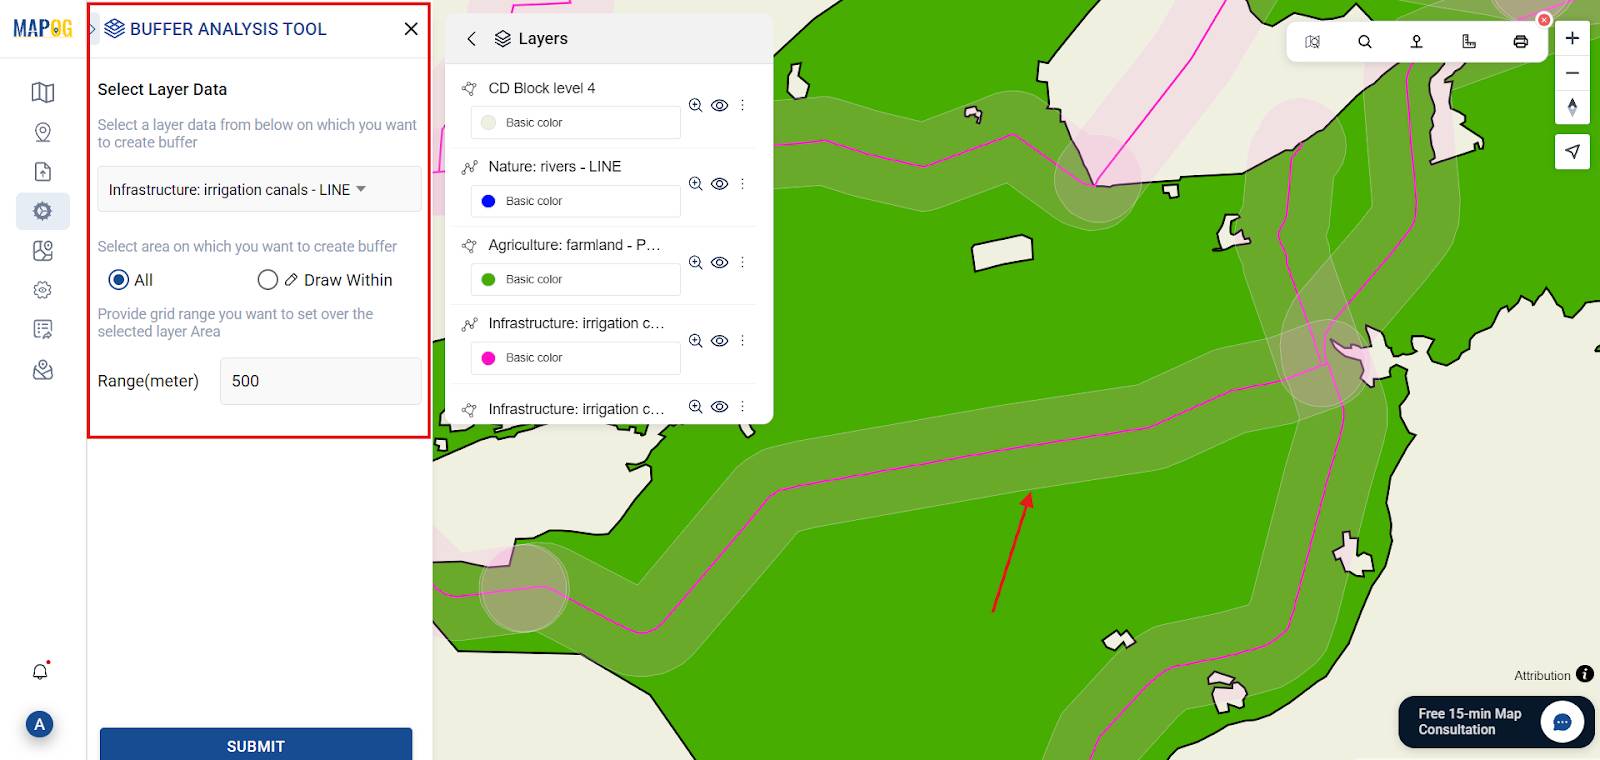
On the left-hand side, click “Process data.”
Then, select Buffer Analysis from the processing options.
Next, a window opens :
- Select Layer Data: Choose Irrigation Line.
- Select area: Select All.
- Range (meter): 500
Finally, click Submit to execute the analysis.
Step 5. Identify Dry Farmlands
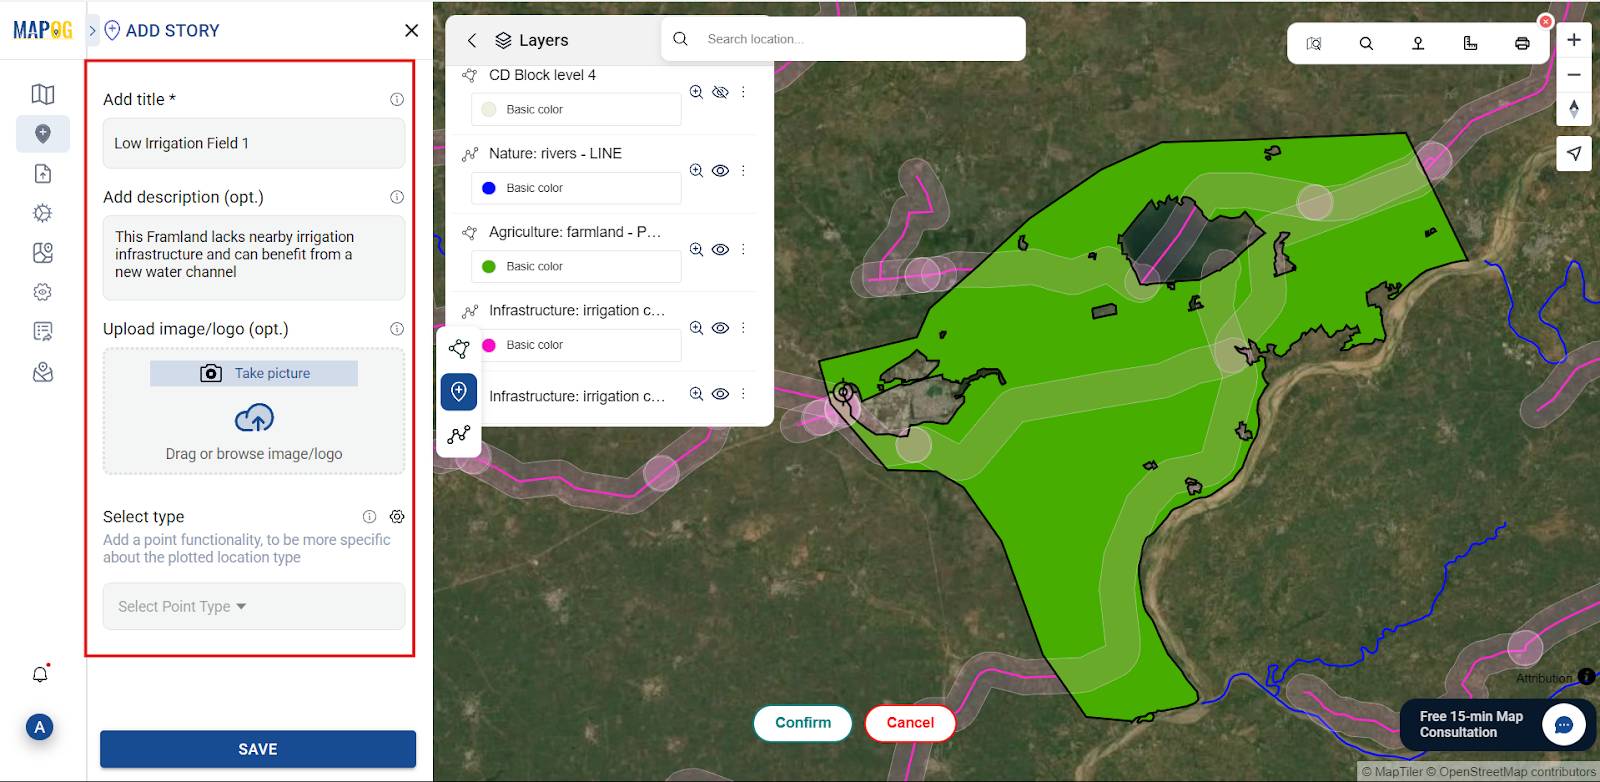
First, identify farmlands located away from canals or rivers, which can be assumed as dry farms.
Additionally, use the satellite view from basemap options to spot dry zones — look for light brown or barren patches.
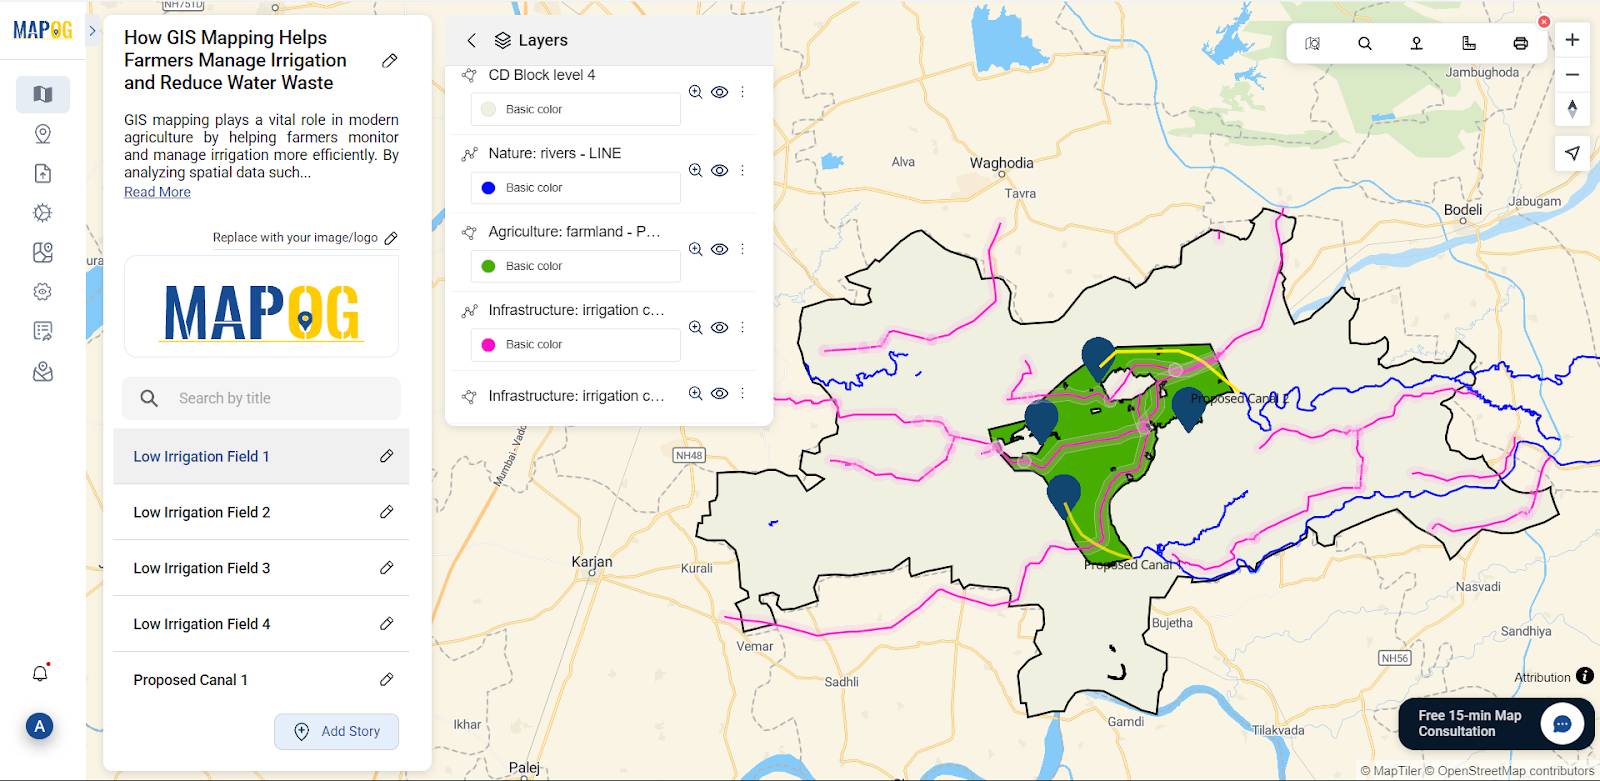
Then, click the “Add Story” tool to mark, use add manually option. Search for the farm which is dry and far away from the water canal or river. Point the marker on that area or farm and press Confirm. Click Save. Name these fields as “Low Irrigation Field.”
Step 6. Draw New Irrigation Channels
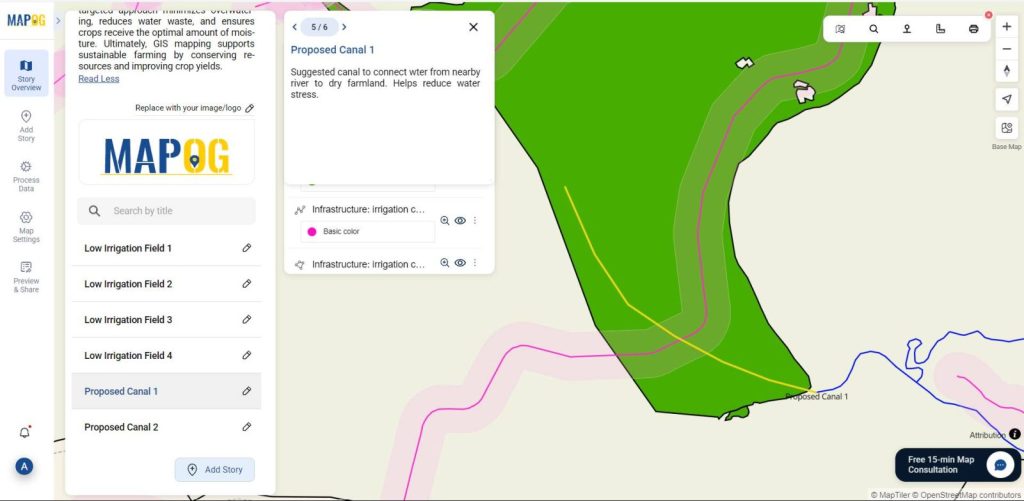
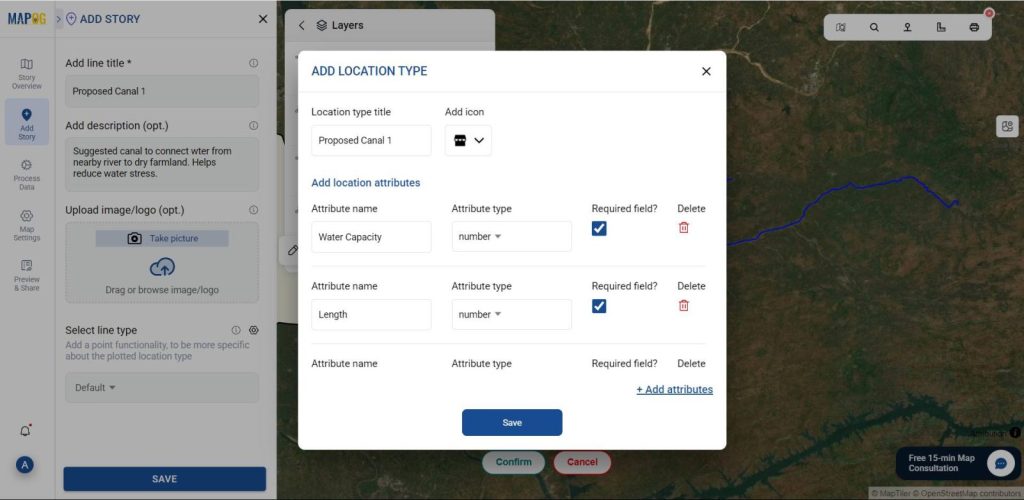
- Next, use “Add Manually” from the “Add Story” button.
- Then, draw lines from nearby rivers or lakes to the dry farmland markers.
- Label these as:
“Proposed Irrigation Channel 1”, etc. - Finally, add descriptions such as:
“This canal will connect the lake to dry fields in the southwest corner.”
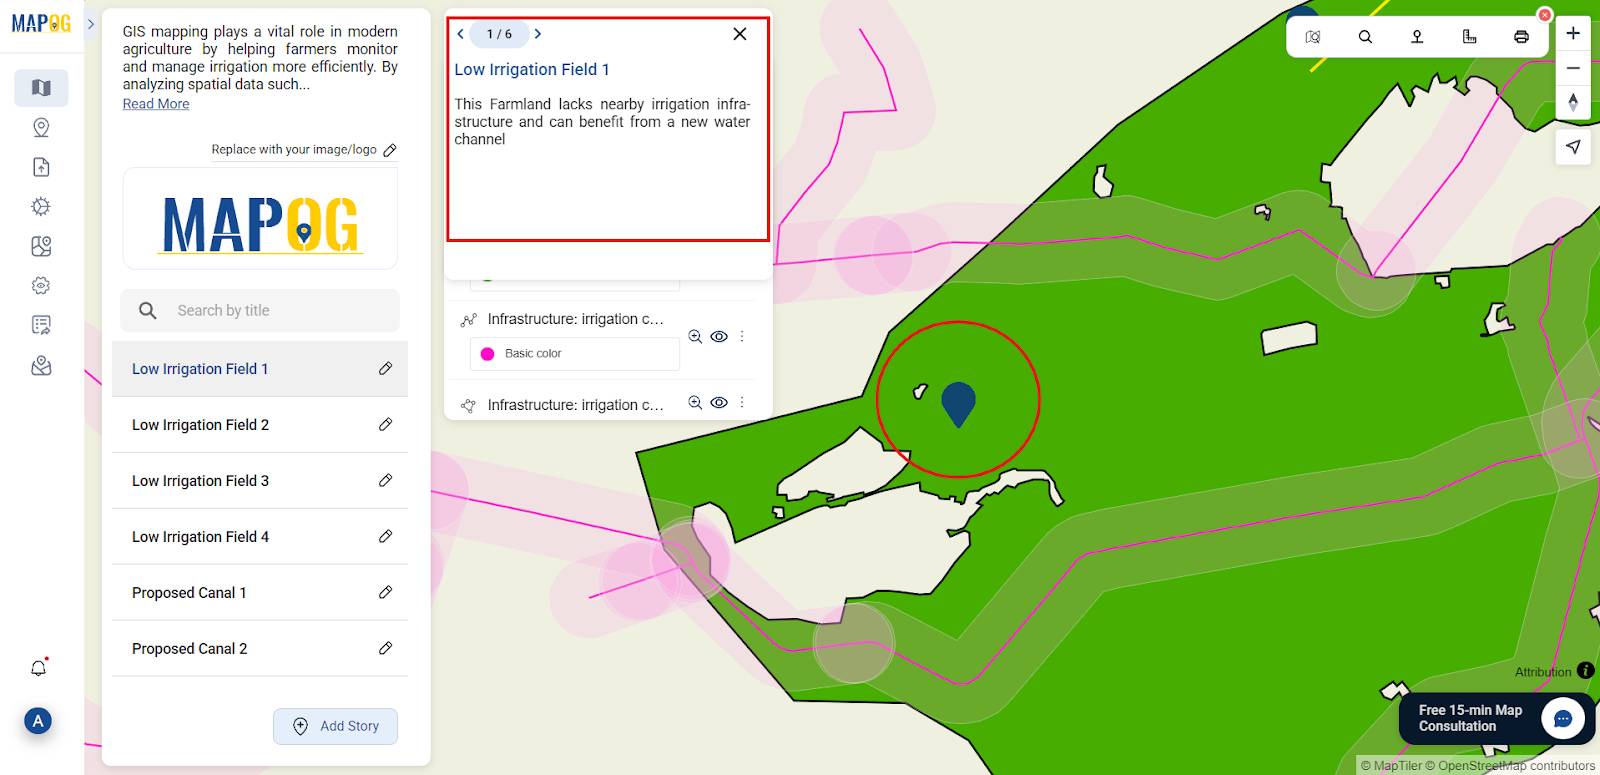
Click on the pencil icon, then go to edit point details, click on the select type settings section, add new attribute type name, add several attributes under it and save it, then select the attribute you created from select type drop down & add information there & save the point.
Step 7. Interpret and Share Results
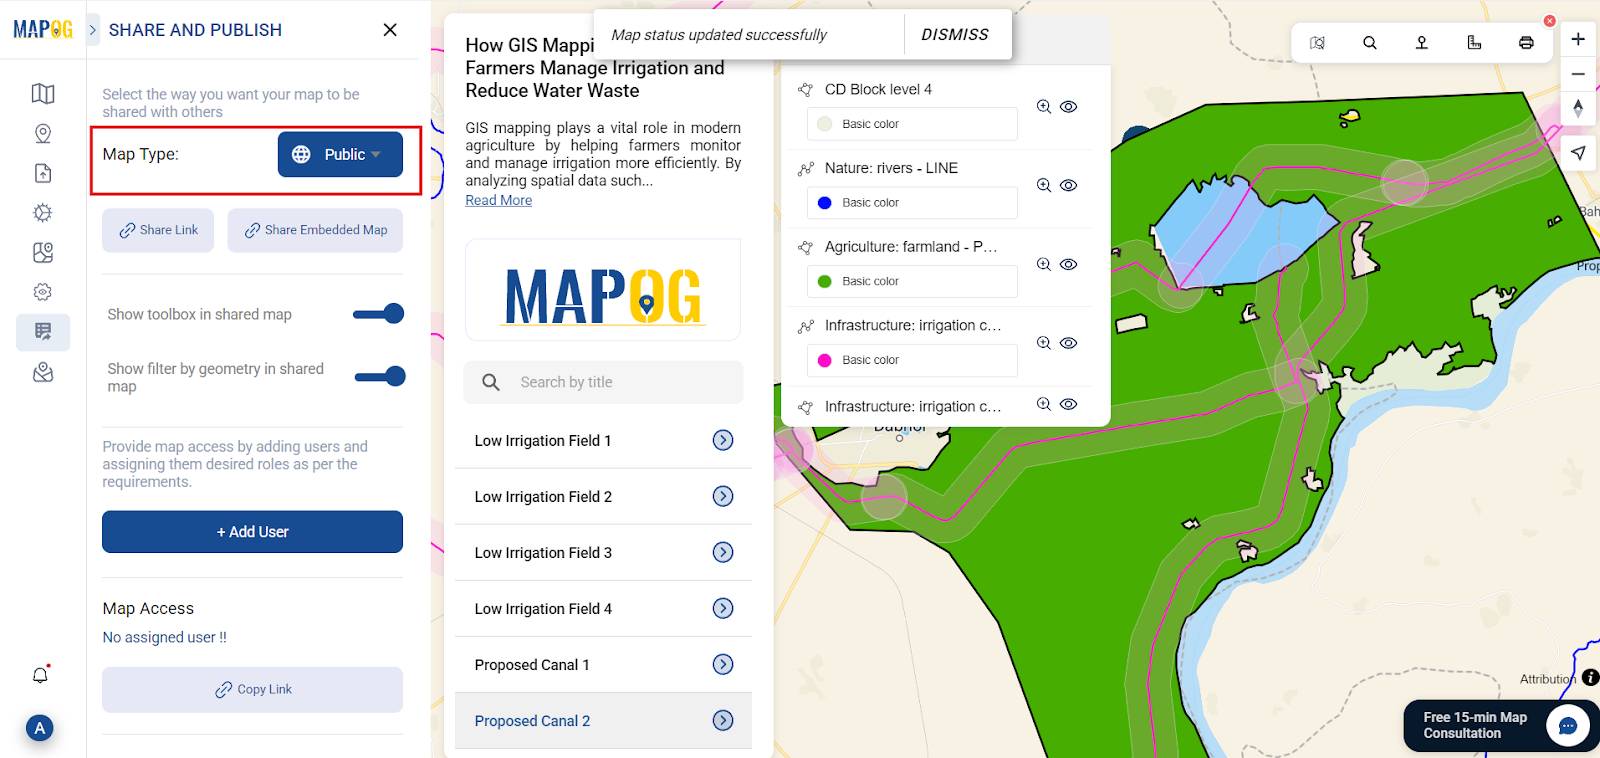
- Once mapping is complete, export or embed it using Publish and Share.
- Then, set the map type to Public.
- Finally, review and share it with stakeholders for planning and preparedness.
The findings are based on simple observation through the MAPOG map. We marked farms far from rivers and drew canals as dry or low-irrigation channels to connect them to nearby lakes or rivers. In this way, farmers can identify zones more prone to irrigation and thus save water by creating channels to dry zones.
Why GIS Matters in Irrigation and Water Management
GIS plays a crucial role in irrigation planning as it enables farmers, engineers, and policymakers to visualize and analyze water data effectively. The key benefits include:
- Optimal site selection: Identifying ideal spots.
- Designing networks: Additionally, planning efficient pipelines and channels.
- Monitoring distribution: Thus ensuring even water use without waste.
- Preventing erosion: Similarly, detecting floods and planning drainage.
- Supporting sustainability: Finally, helping farmers adapt and protect resources.
GIS Data Used:
Conclusion
GIS therefore helps farmers and planners make sustainable decisions. Furthermore, MAPOG also simplify this, thus enabling even small organizations to create maps without necessarily requiring expertise.
For example, creating flood maps, analyzing drainage, and optimizing water use not only reduces waste but also improves productivity.
Here are some other articles you might be interested in: