Using filters to view only the data you need on your map is one of the most effective ways to turn complex location datasets into clear, actionable insights. Instead of navigating through cluttered points, filters help you spotlight the information that truly matters, whether it’s by category, status, rating, or any other attribute. This focused approach makes your map easier to interpret, reveals hidden patterns, and supports smarter decision-making.
With MAPOG, using filters is simple and intuitive. You can apply multiple conditions at once, and instantly highlight only the points that matter for your analysis.
Key Concepts on how to use filters to view data you need on map
Filters play a crucial role in making map-based data easier to understand and work with. Instead of viewing every point at once, you can use filters to view only the data you need on your map, refining the display to show locations that match attributes you care about, such as category, type, rating, status, or area.
By applying multiple filters together, you can create highly focused views, like showing only hospitals with emergency services or only high-rated facilities in a specific locality. Filters also help you work with numeric ranges, compare different categories, and focus on active or relevant data without unnecessary clutter.
Step by Step Guide on how to use filters to view data you need on map
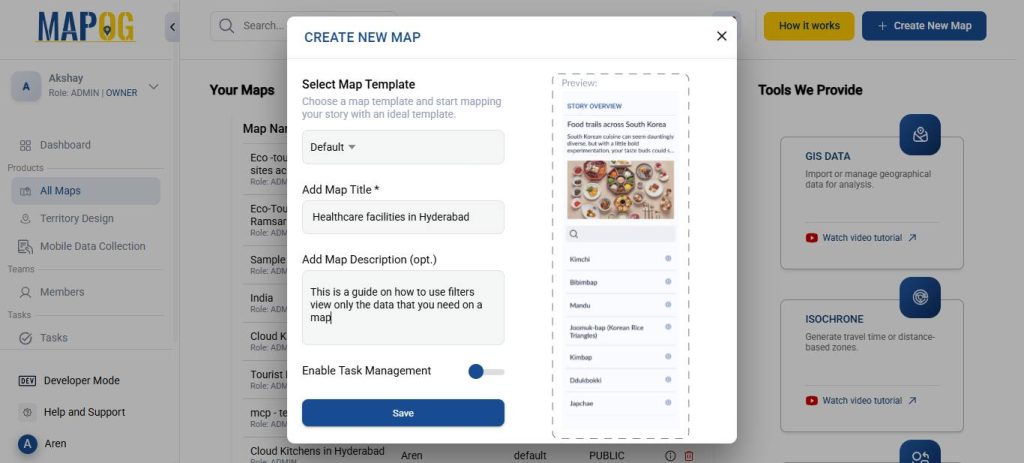
1. Start with a New Map
Open MAPOG and click on “Create New Map”, give your project a title and a brief description, then hit save.
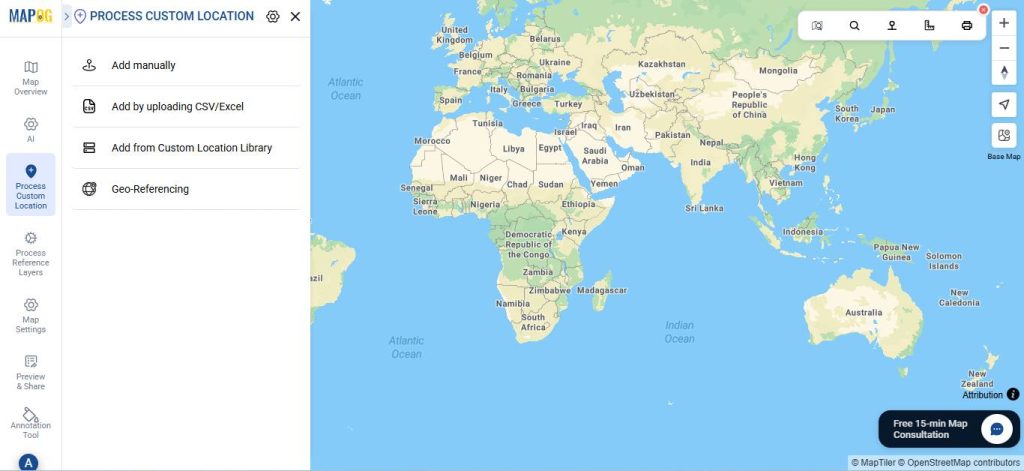
2. Add coordinates using an Excel or CSV file
Go to Process Custom Location and then select “Add by uploading CSV/Excel”.
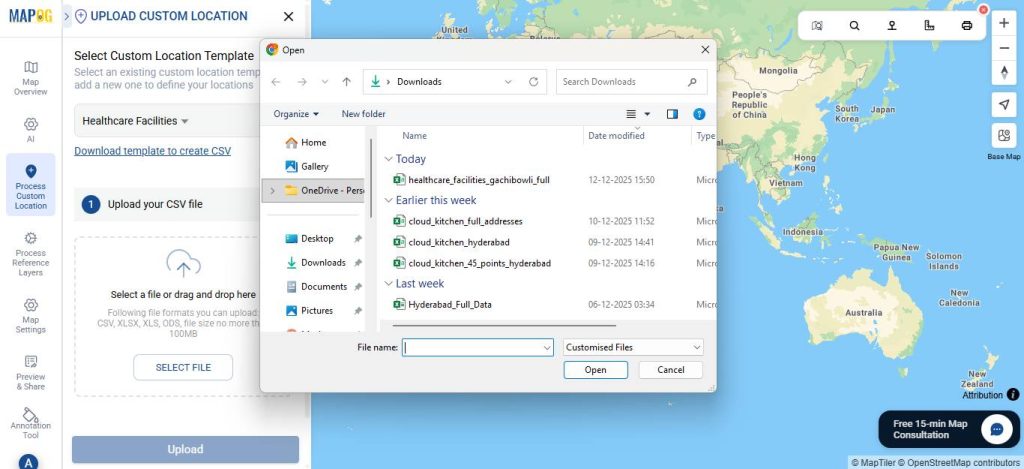
And then upload your desired Excel file.
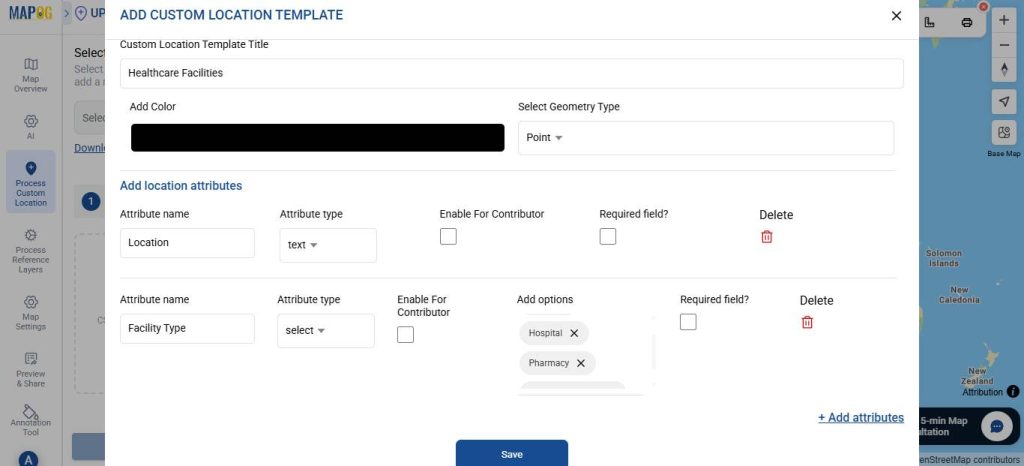
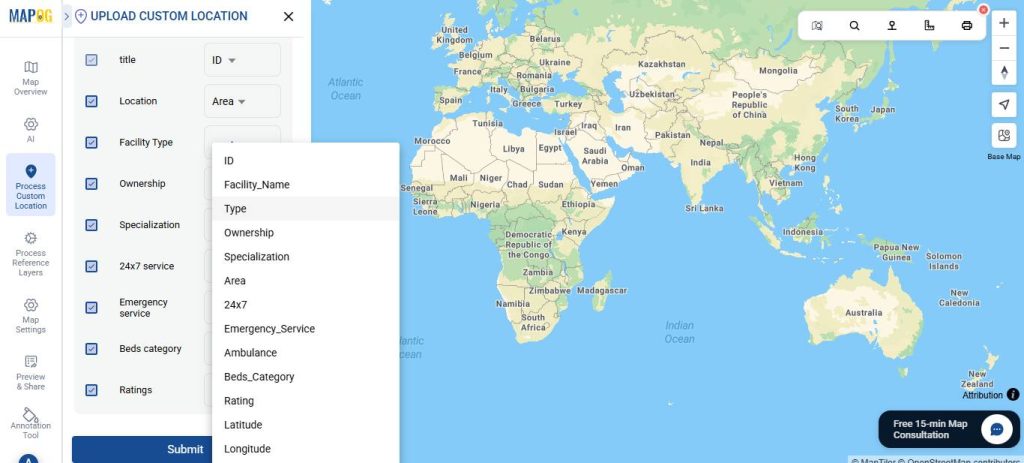
Go to Select Custom Location Template settings option, add custom location template, such as Healthcare facilities, as here we use a dataset pertaining to it. Then input necessary attributes such as the Location, Facility Type, Ownership etc.
Then, match your Excel columns with the corresponding attributes.
Selecting the appropriate field type for latitude and longitude (or WKT location, if preferred). In this example, we match the fields with latitude and longitude respectively. After that, click Submit.
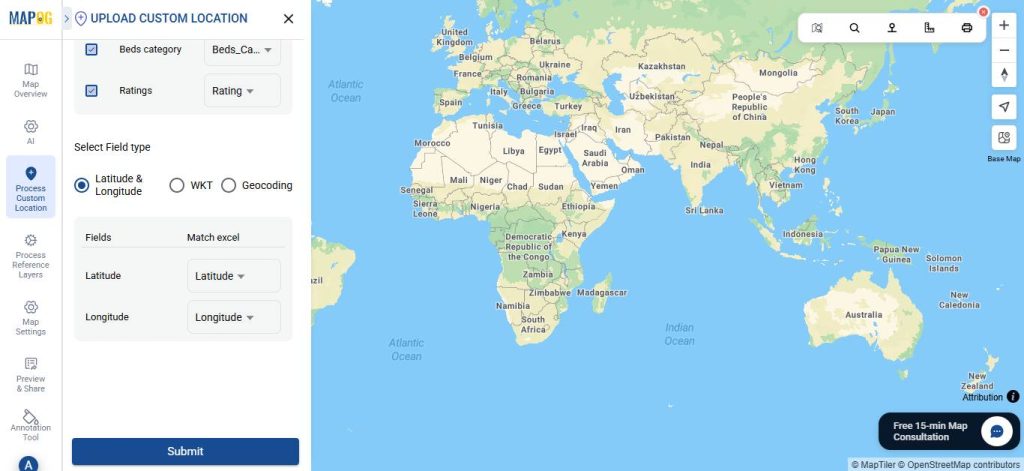
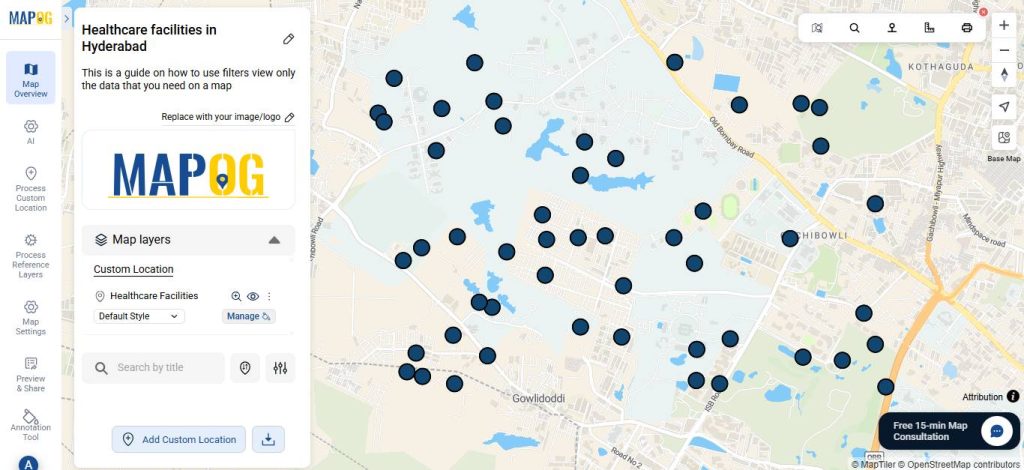
Your points will now appear on the map.
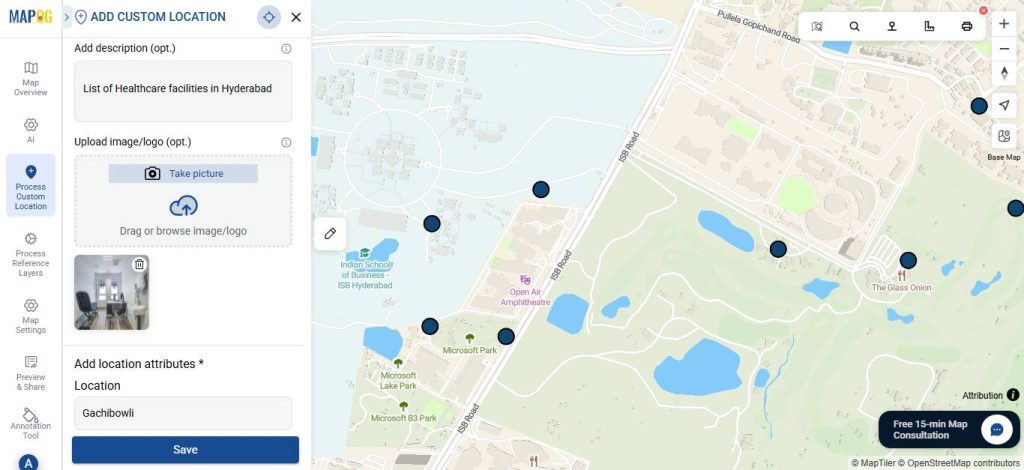
3. Editing the points
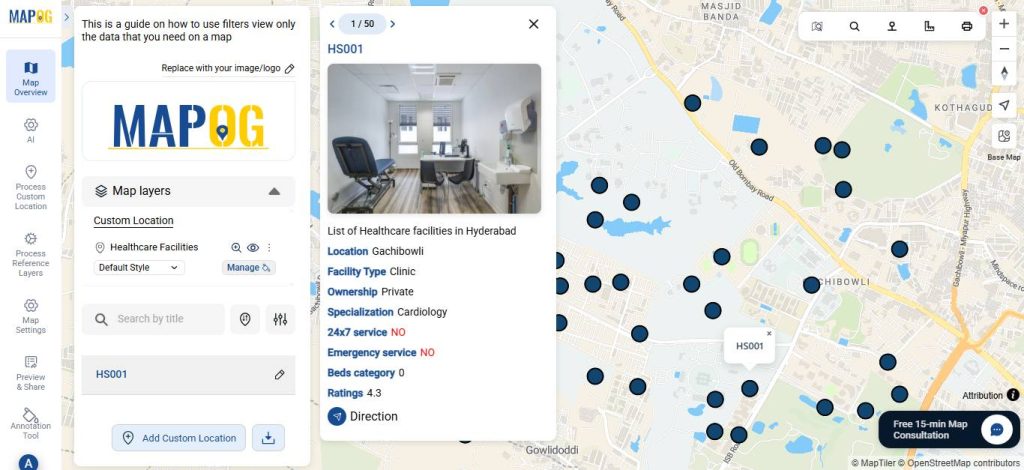
Go to Edit point details. Next, upload relevant image for your point to complete the necessary attributes, then click Save.
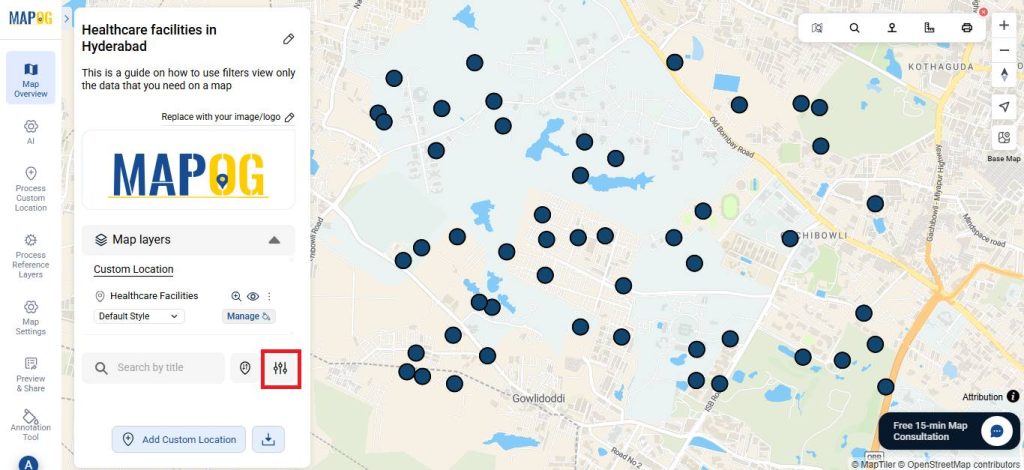
4. Use filters
Open the filters panel, choose the parameters you want to filter the data with, and then click Apply.
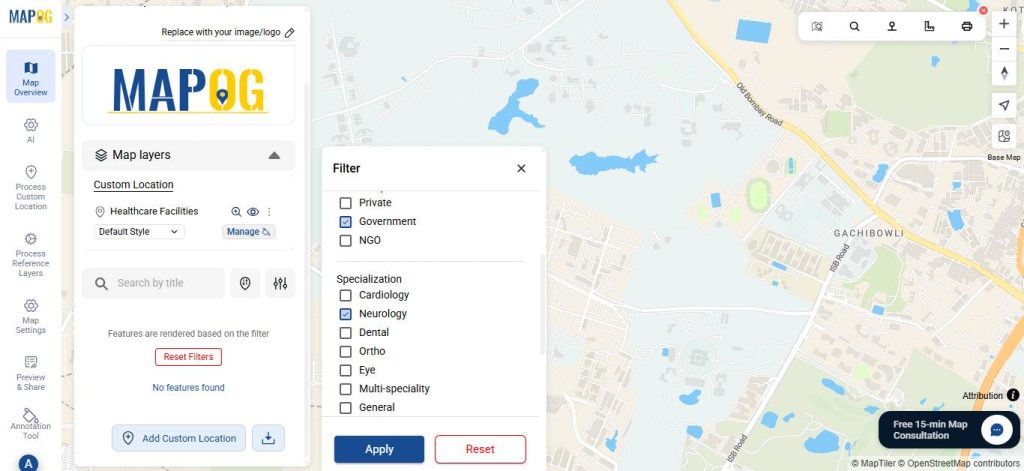
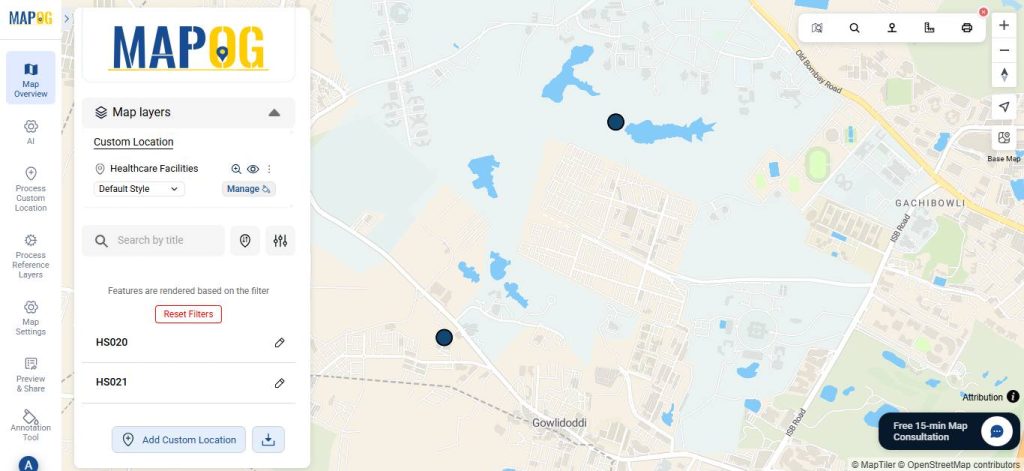
Only the filtered points will now appear.
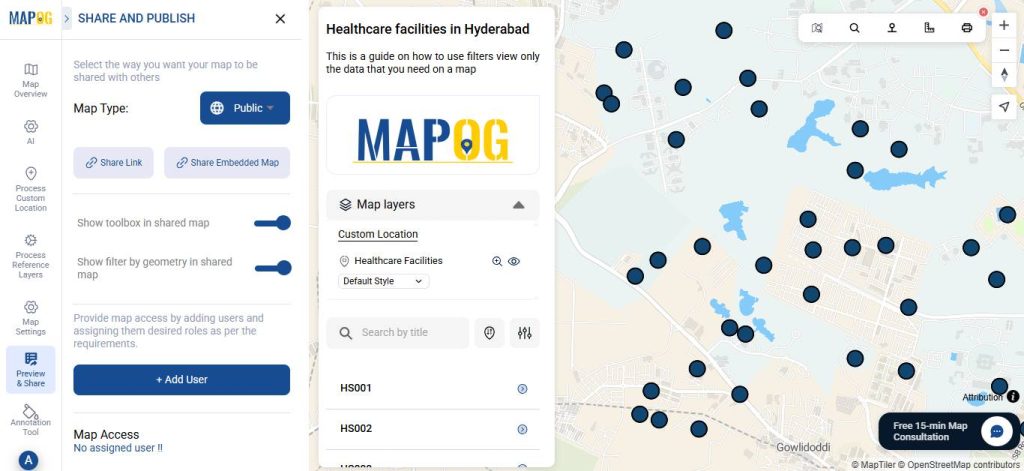
5. Share Your Map
Once your map is ready, click “Preview and Share”. You can also set your map to Public for wider visibility and share it using the Share Link option.
Real World Applications
Filters on map-based data are used across countless real-world scenarios to make location information actionable. Businesses rely on filtered maps to identify high-performing stores, analyze delivery zones, or track only active customer locations. In healthcare, filters help visualize hospitals by specialization, emergency services, or availability of beds, which is essential for planning and resource allocation.
Urban planners use filters to separate residential, commercial, and industrial zones, while government agencies track utilities, complaints, and public facilities by status or priority. Delivery and logistics companies filter routes by traffic, order volume, and service regions to optimize operations.
Conclusion
Using filters on map-based data turns a simple visual display into a powerful decision-making tool. Instead of getting overwhelmed by hundreds of points, filters let you focus on exactly what matters—whether it’s by category, location, status, or any custom attribute. This not only improves clarity but also helps reveal patterns, solve problems faster, and make smarter, data-driven decisions. With MAPOG, applying filters is effortless, enabling anyone to transform raw location data into meaningful insights that can be explored, shared, and acted upon.