When working with large datasets on a map, it can be difficult to focus on only the information you need. By filtering map points using attribute values stored in an Excel or CSV file, you can quickly highlight specific categories, ranges, or conditions—such as cities above a certain population, demographics, or locations with active status. With MAPOG, you can customize the displayed data, perform targeted analysis, and create more meaningful visual insights. Whether you’re preparing a presentation, conducting spatial analysis, or simply cleaning your dataset, attribute-based filtering is an essential tool for making your maps clearer and more actionable.
Key Concept of the map
The key concept behind this map is to enable dynamic filtering of location points based on attribute values imported from an Excel or CSV file. This approach allows users to isolate and visualize only the information that is most relevant to their needs. As an example, a travel agency might narrow down destinations for their clientele based on factors such as budget, preferred activities, or age group to highlight the most suitable options. By showing only selected points, the map becomes more focused and easier to interpret. Whether you’re preparing a presentation, conducting spatial analysis, or organizing your dataset, attribute-based filtering helps ensure that your map remains clear, purposeful, and easy to work with.
Step-by-step method of creating the map
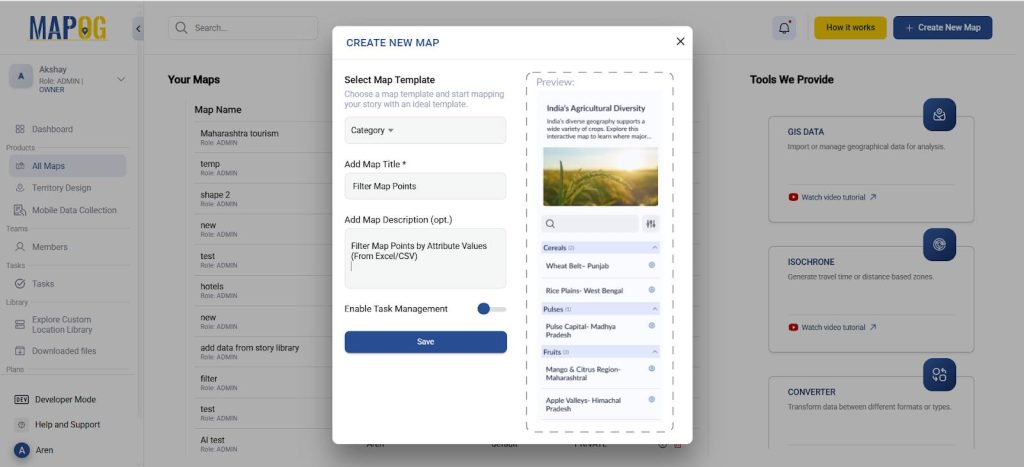
Step 1: Create a new map
Go to MAPOG and create a new map, choose the map template as ‘Category’. Further, you can add a title and description for your map and save it.
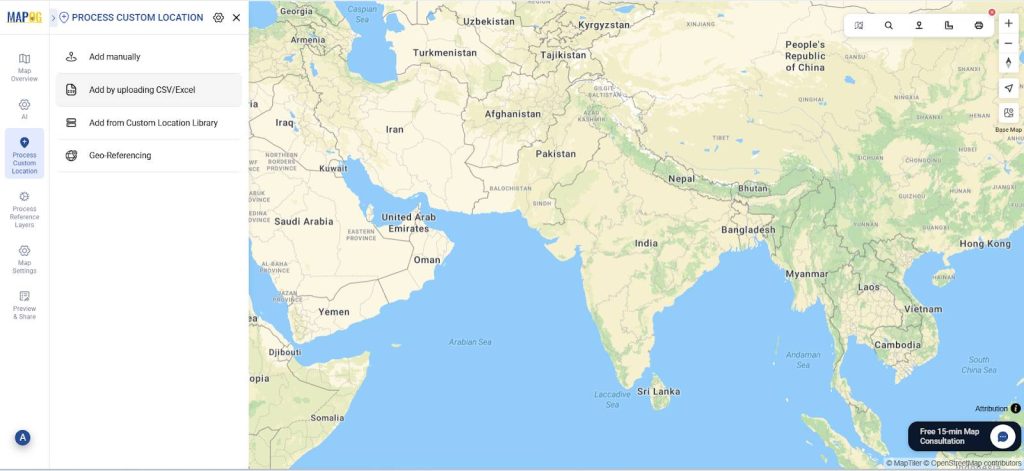
Step 2: Add your excel/CSV file
Now, go to process custom location and select add by uploading excel/CSV.
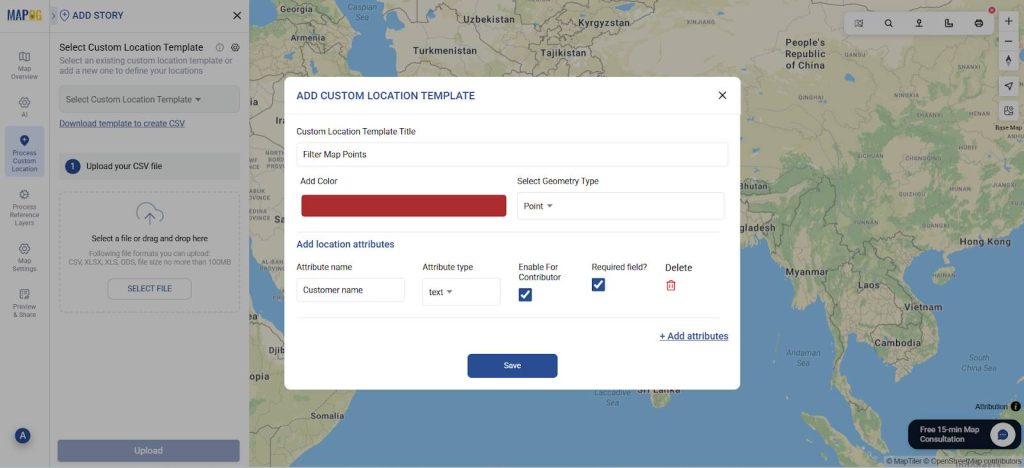
Next, go to ‘Select Custom Location Template’ settings and add your custom location template along with necessary attributes like customer name, address, etc. Select the custom location template that you created. Next, select your excel file with all your data and upload.
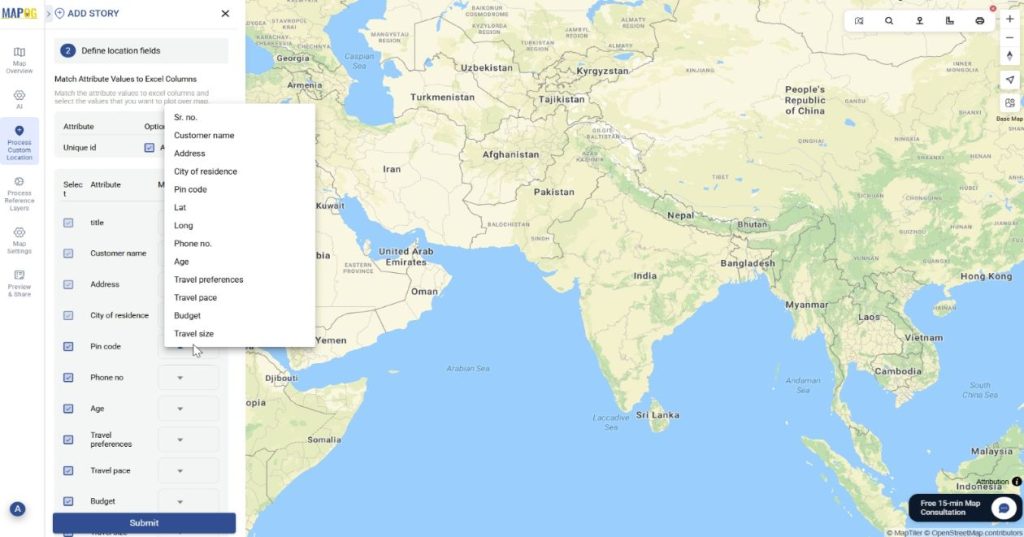
Finally match the attributes to your excel columns and see your data on the map.
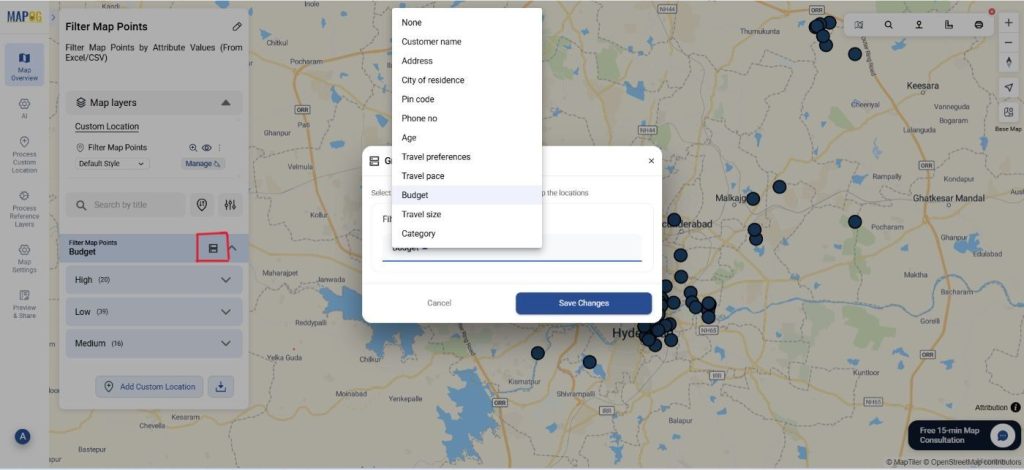
Step 3: Group By Attributes
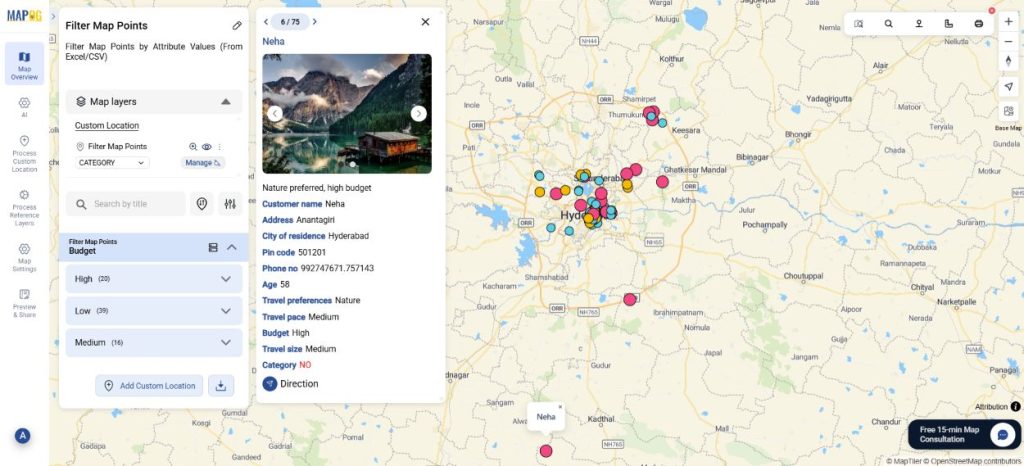
Next, go to Group By Attribute. Here, select the attribute that you wish to filter your data by. Therefore, you will have your data grouped by whichever attribute you choose. Suppose you want your data filtered by the budget of your customers or their travel preferences, you can choose these attributes from the drop-down and save changes.
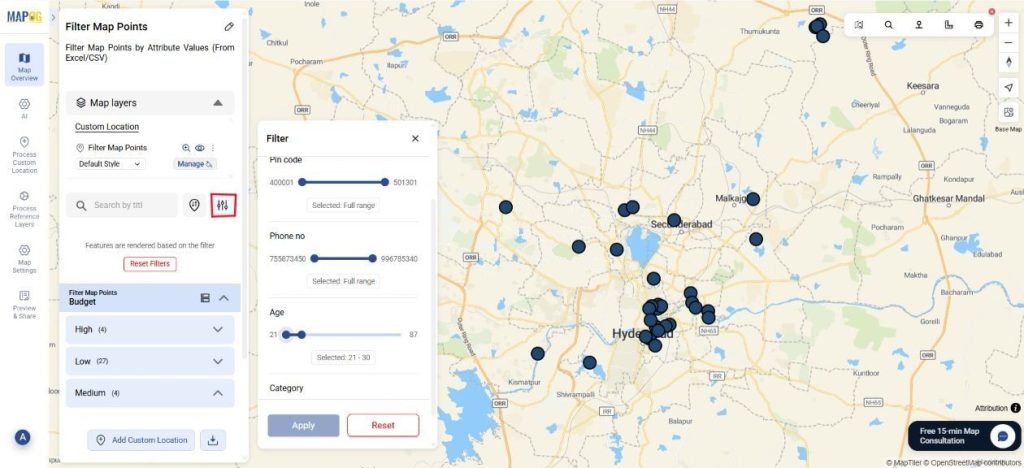
Next, you can sort and filter the map points within the grouped attributes. Simply go to the filter option and filter by Age or Pin code and apply. Afterward, your data will be filtered by your chosen attribute.
Step 4: Customize points by attributes.
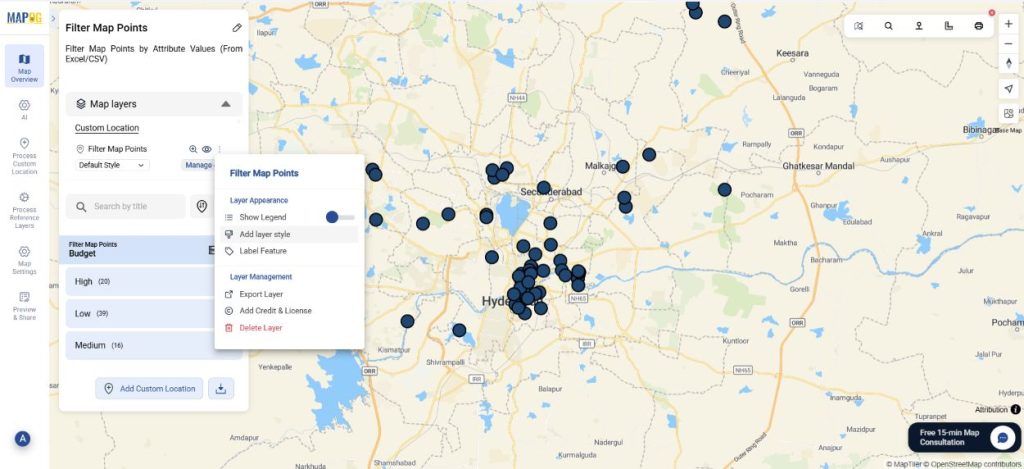
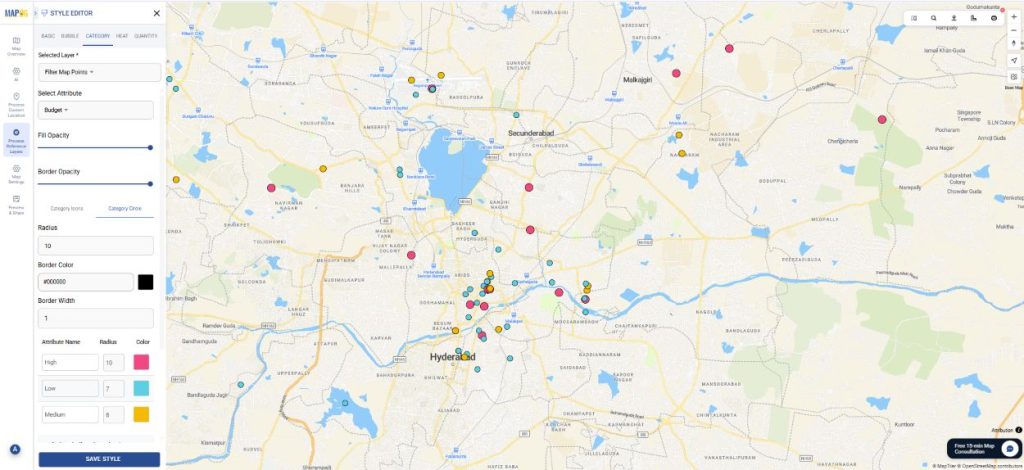
Further, you can select the add layer style and choose style by category. Select the same attribute you did while filtering. Choose your choice of color and icon size and save the style.
The data will appear differentiated on the basis of colour and size for your attribute.
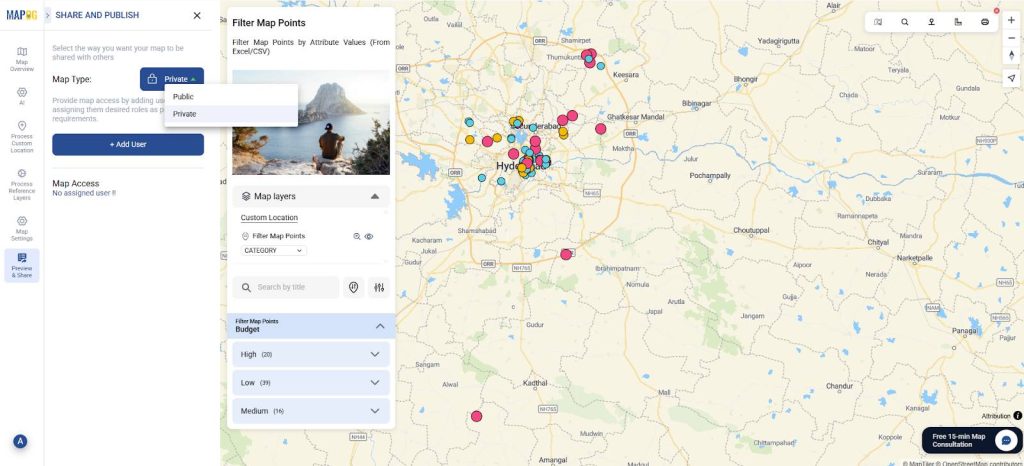
Step 5: Preview and Share
Finally, once your map is complete, click “Preview and Share”. You can keep it private or share with your team.
Industrial uses and benefits
In industrial settings, attribute-based filtering helps organizations manage and interpret large amounts of spatial data more efficiently. Logistics teams can filter distribution centers by capacity or delivery routes, retailers can highlight stores by sales performance or product availability, and travel agencies can filter destinations by budget, preferred activities, or age group. By narrowing the view to only the most relevant points, this method improves clarity and supports quicker, more informed decisions across various industries.
In conclusion
Using attribute values from Excel or CSV files to filter map points makes it easier to extract meaningful insights from large datasets. Whether refining travel options, analyzing spatial trends, or managing industrial operations, with MAPOG you can display only the information that truly matters. The result is a map that is easier to interpret, more efficient to work with, and better suited for informed decision-making across a wide range of applications.