When you plan a journey, visuals make all the difference. Traditional paper or static digital maps can show directions, but they often fall short of engagement. That’s where interactive maps come in. In the debate between interactive maps vs static maps, interactive ones clearly offer more flexibility, storytelling potential, and real-time exploration. Using MAPOG, travelers can now turn routes into living stories that connect every experience on the map.
Key Concepts of Interactive Maps vs Static Maps
The concept behind comparing interactive maps vs static maps lies in how travelers interact with information. Static maps are good for quick reference, but interactive maps let you:
- Visualize routes dynamically: pan, zoom, and connect multiple locations.
- Attach data-rich details: add photos, videos, and notes at each destination.
- Plan day-by-day experiences: using map layers to track time, distance, and activity.
By combining visuals with data, travelers can transform itineraries into immersive storytelling journeys.
Step-by-Step Process: Building an Interactive Itinerary Map
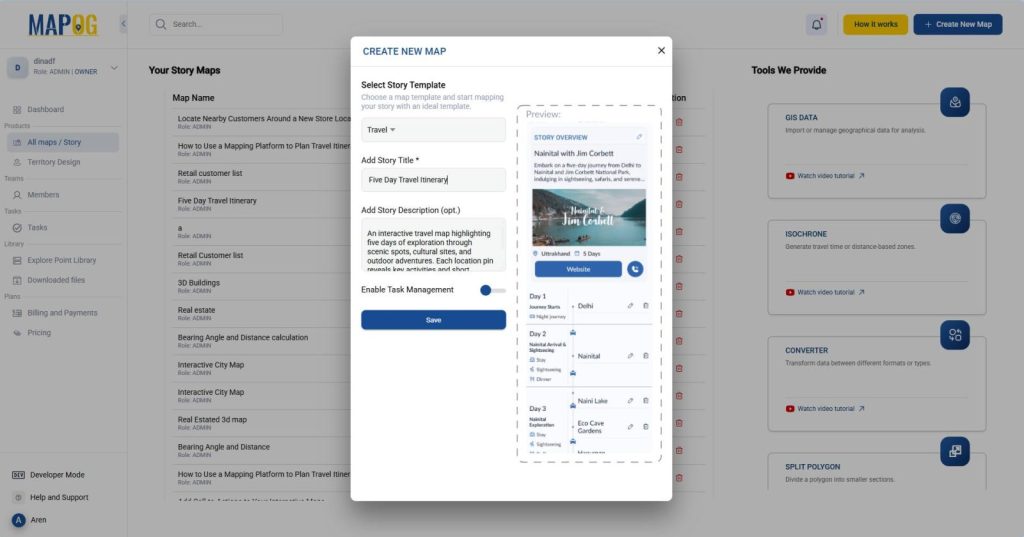
1. Create Your Map
Visit MAPOG and create a new map using the Travel template. Then Give it a title like “Five Day Travel Itinerary”. Add a short description.
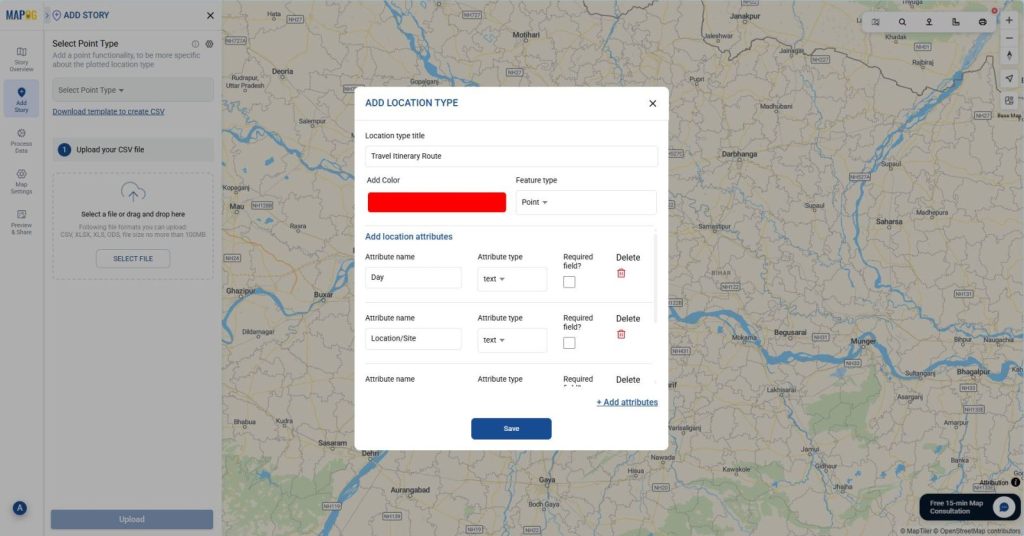
2. Create a new Point type
Now, Go to Add Story and then Add by Uploading CSV/Excel. Next create a new point type by clicking on the settings icon near select point type and then click on “add more location type“. Give a Location Type title, add color and select a suitable feature type (e.g., Point). After that add attributes fields like Day, Location/Site, Activity, Description etc. by clicking on “add attributes” and “Save”.
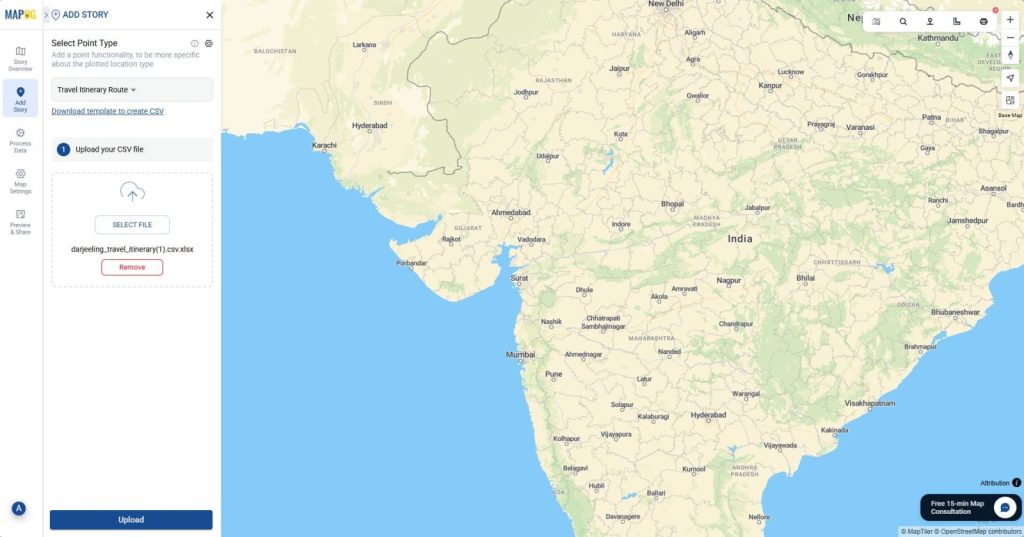
3. Add Story Points Using CSV
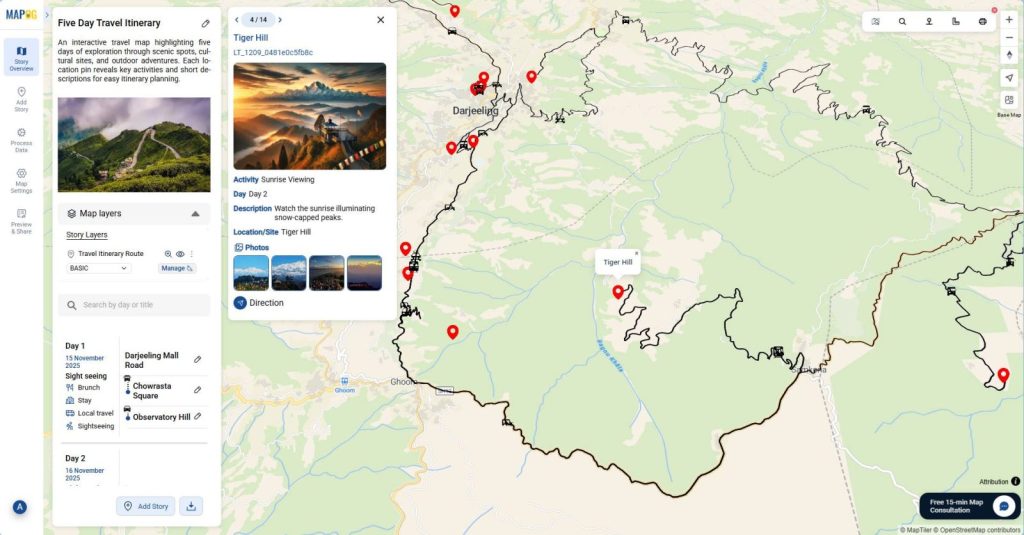
Then Select the point type you’ve just created and Upload your itinerary CSV file. Each row already includes latitude, longitude, Day, Location/Site, Activity, and Descriptions.
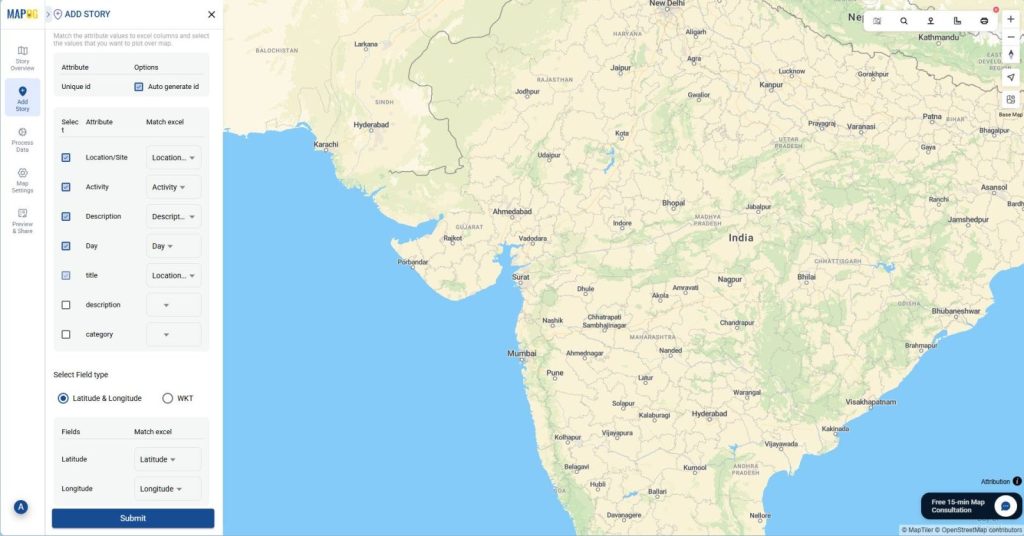
After that match all your Excel or CSV columns to the attributes, select Latitude and Longitude for locations, and click “Submit”. Once submitted, each point becomes a clickable story marker on your map.
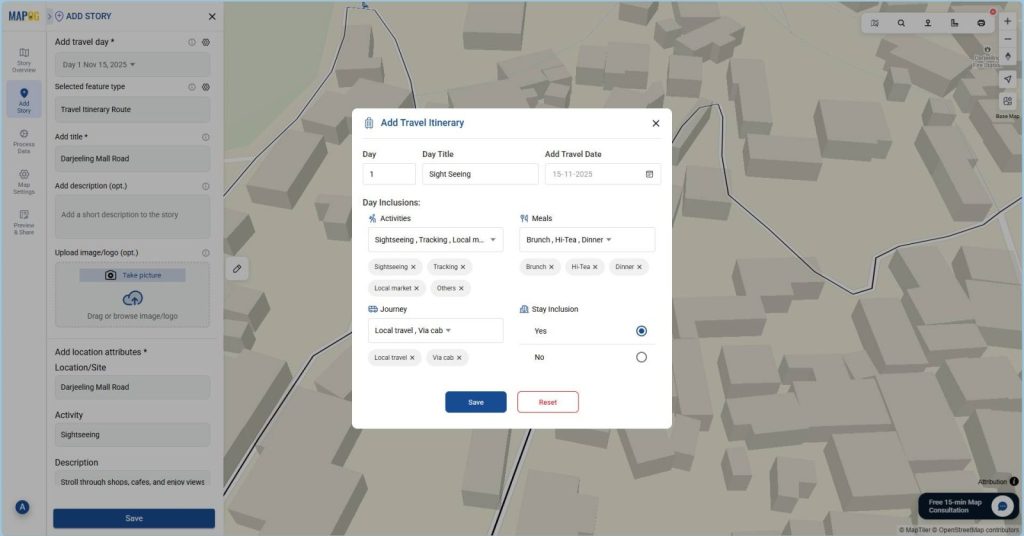
4. Day of Visit: Day 1–Day 5
Then, categorized all activities using a day-based structure to indicate which day of your travel each location falls on (Day 1–Day 5). Go to edit point details, then click on Add Travel Day settings icon and enter the day number, title, and details. Add notes about activities, meal timings etc. This gives clarity to your itinerary and makes your interactive map easy to follow.
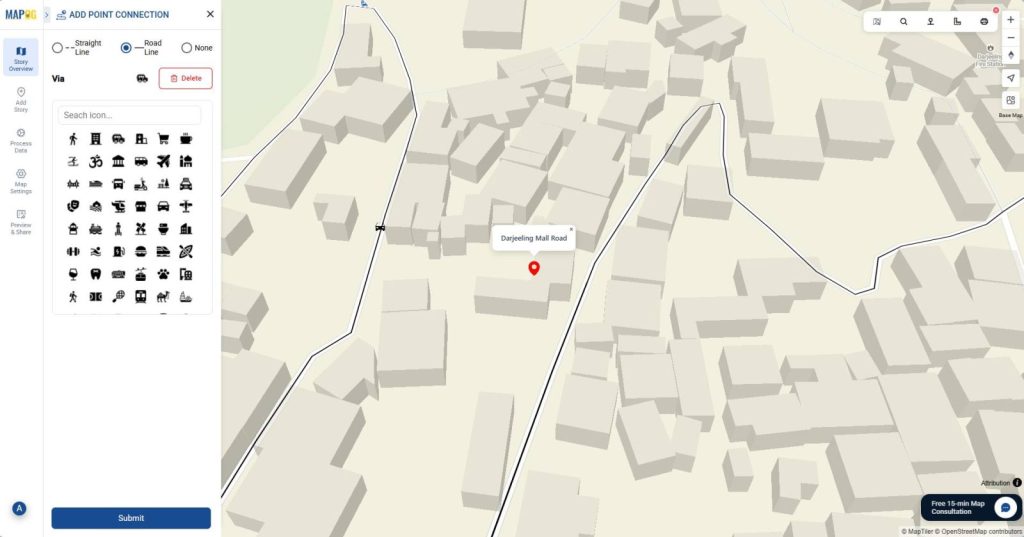
5. Customize Points and Connections
Now, customize each Points Under “Add Style Layer” then “Basic“, change colors and icons for points.
Then use “Location Connections” to draw routes between stops, creating a flowing itinerary from day one to day five.
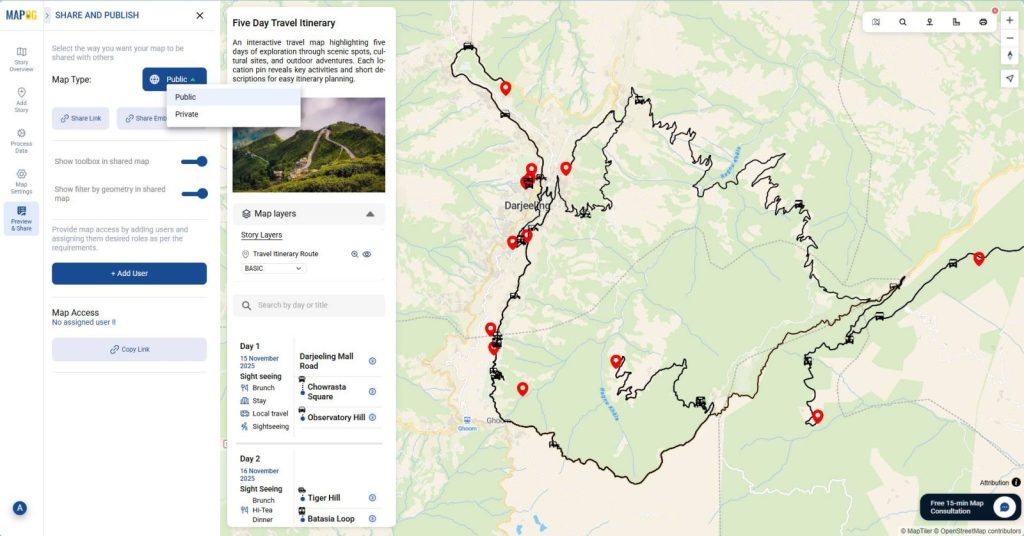
6. Preview and Share
Finally, click on Preview & Share to review your interactive map. You can embed it on your travel blog or share it directly with your audience. Unlike static maps, interactive maps allow real engagement, helping others follow or modify your journey.
Industries and Domains Benefitting
Tourism, event planning, education, and media industries gain the most from interactive maps. Travel agencies use them for itinerary planning, bloggers for storytelling, and educators for visual field studies. Clearly, when comparing interactive maps vs static maps, interactive ones empower users to explore data dynamically and communicate visually.
Conclusion
Interactive maps make travel stories come alive. They turn plain coordinates into experiences that can be explored, shared, and remembered. Compared to static maps, interactive ones add depth and connection, letting travelers visualize routes and relive moments vividly. With MAPOG, creating these maps becomes effortless, you can upload data, style routes, and share journeys instantly.