If you’re looking to add Excel data to geographic boundaries using Excel attributes, you’re stepping into one of the most efficient ways to visualize and analyze location-based data. Whether it’s population statistics, sales figures, or demographic details, aligning spreadsheet data with geospatial boundaries helps uncover trends you might otherwise miss. Fortunately, MAPOG simplifies this process through its intuitive Add Upload Data and Excel Attribute features—no advanced GIS skills required.
Key Concept: Add Excel Data to Geographic Boundaries
At the core of this process, lies a method called Excel attribute, where data from an Excel or CSV file is matched with geographic shapes using a common field such as “State Code” or “Region Name.” In essence, the goal is simple: to enrich spatial layers with external attributes—bridging spreadsheet data with map visuals. In this regard, MAPOG streamlines the workflow, letting users add Excel data to geographic boundaries quickly and efficiently.
Step-by-Step Guide to Join Excel Data with Geographic Boundaries
1. Start Your Mapping Project
Visit MAPOG and click “Create New Map.” Add a title, description, and hit save to begin working on your interactive canvas.

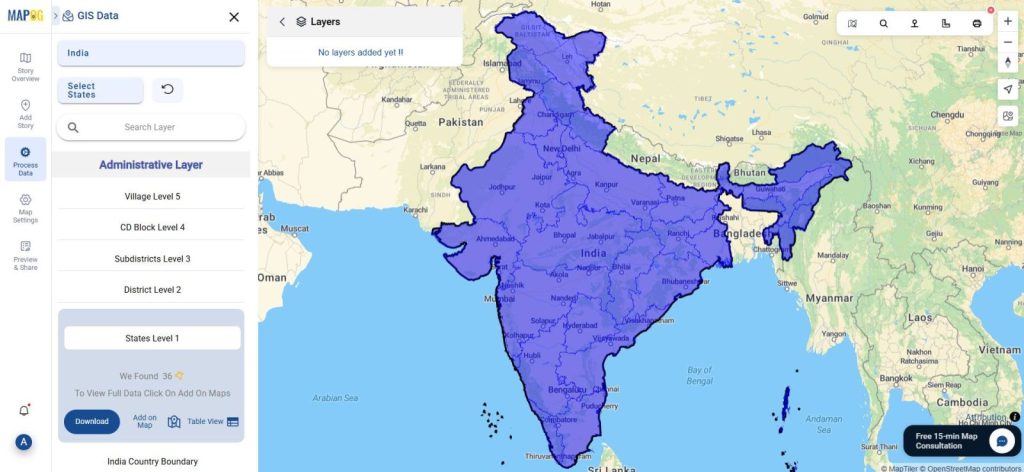
2. Add Geographic Layer via “Add Upload Data”
Navigate to Process Data > GIS Data under Add Upload Data. Filter your desired country and state, then load the appropriate state or region layer onto the map.
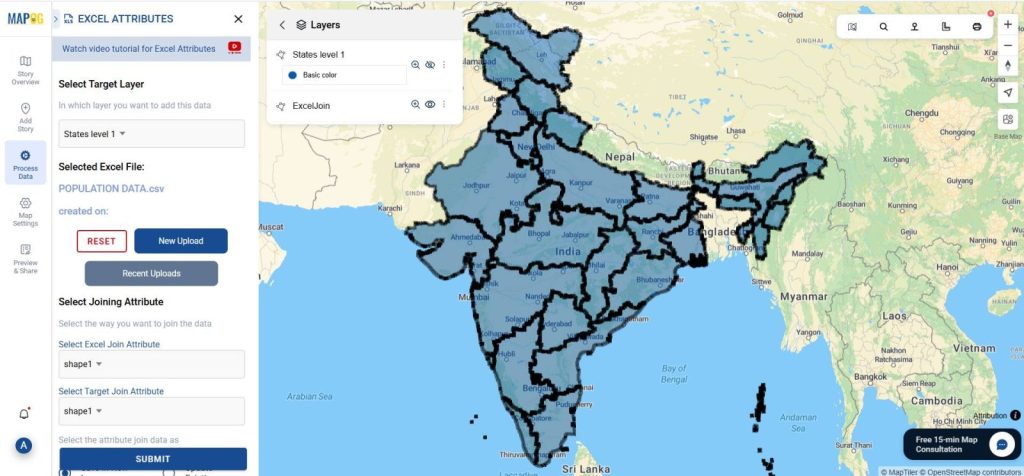
3. Join Excel Data to Boundaries
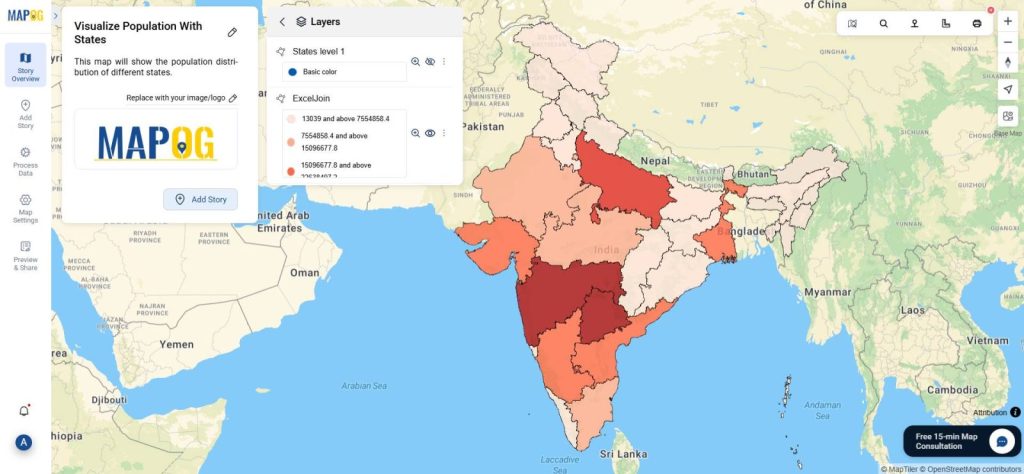
Go to Process Data → Excel Attributes. Select the target layer (e.g., state boundaries). Upload your Excel sheet that carries population data. Choose matching fields from both Excel and GIS data. You can either update the existing layer or save as new. Also select the joining operation.
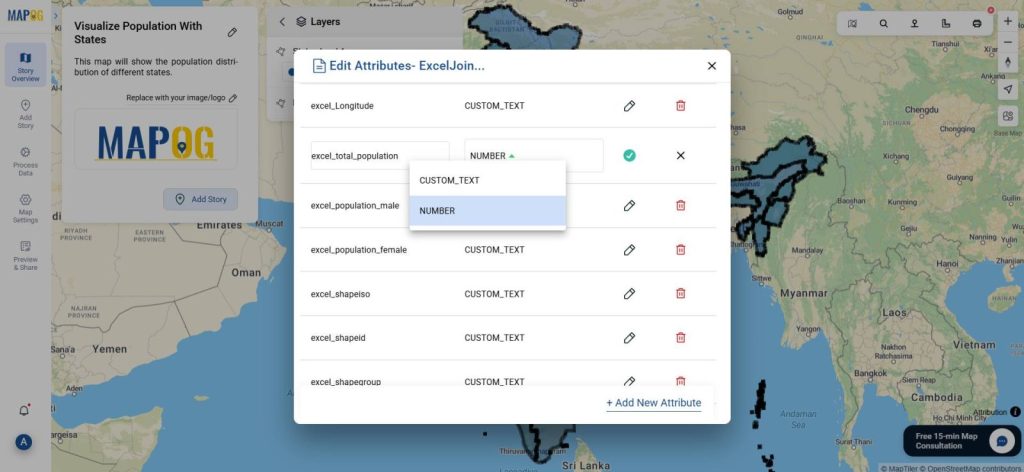
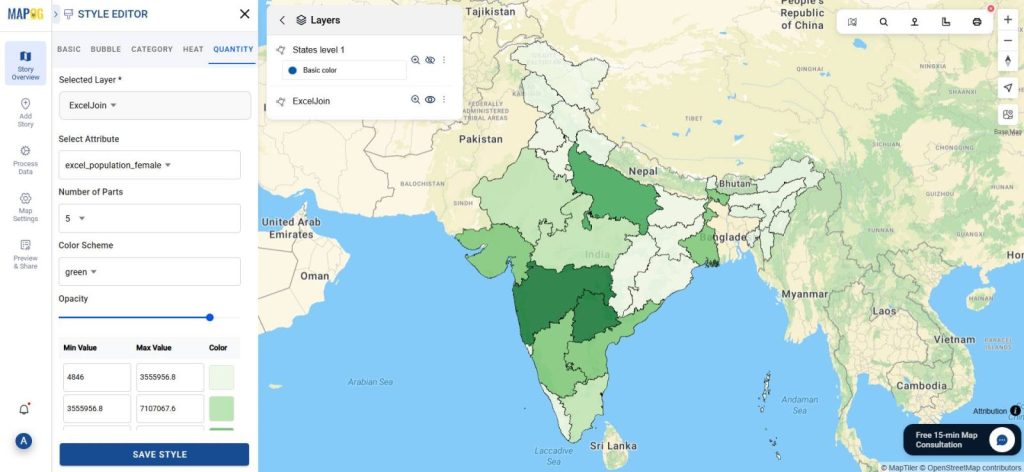
5. Edit and Style Your Data
Use Edit Attributes to refine any field types or label formats.
Apply Quantity Style under Style Layer, choose the joined attribute (like “female Population”), set the number of parts, colors, and adjust transparency and save style.
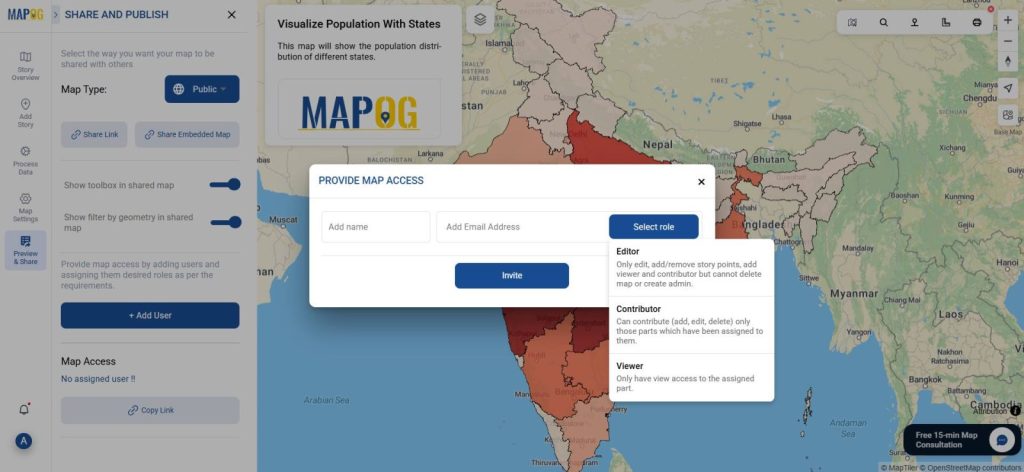
6. Preview and Share
Use the Preview and Share option in MAPOG to make the map public. Share it with your team, partners, to explore and interact with the data-rich visual.
Industry Relevance & Benefits of mapping geographic boundaries
Moreover, adding Excel data to geographic boundaries using Excel attribute is widely adopted across industries:
- In Urban Planning, visualize infrastructure demand by merging census data with city zones.
- For Retail Expansion, match sales data to specific locations for smarter business growth.
- In Public Health, link disease statistics to regions and identify high-risk zones faster.
Clearly, these scenarios all rely on one common thread—adding Excel data to geographic boundaries to unlock deeper spatial insights.
GIS Data Used
Conclusion
In today’s data-driven landscape, the ability to connect Excel files to real-world maps can fundamentally redefine how we approach strategy and planning. Not only does the method to add Excel data to geographic boundaries using attribute join make your data more engaging, but it also makes it significantly more insightful. With MAPOG, you can do just that—easily, visually, and efficiently.