History isn’t just about events it’s about where they happened. From ancient conquests to world wars, every major battle unfolded on a map. In this guide, we’ll walk through how to build a stunning “Historical Battles and War Sites” story map using MAPOG. you can transform history into an interactive journey by creating a “Major Historical Battles and War Sites” story map no coding needed.This quick guide shows you how to use MAPOG’s List View Map to plot key battle sites across time. Perfect for teachers, students, or history buffs, it’s a powerful way to bring the past to life—visually and interactively.
Key GIS Concepts for Historical Battlefield Mapping
GIS transforms how we understand historical battles by revealing how geography shaped military strategies and outcomes. Terrain analysis like hills, rivers, and elevation—shows why certain sites were pivotal. Route mapping uncovers troop movements and supply lines, while overlays of historical maps and satellite maps reveal how battlefields have changed over time. This powerful approach helps reconstruct the past more accurately, giving historians, educators, and archaeologists deeper insights into history’s most decisive conflicts.
Step 1: Log in and Start Your Map
First things first, head over to MAPOG and log in to your account. If you don’t have one, it’s free to sign up. Once you’re logged in, look for the option to “Create New Map.”
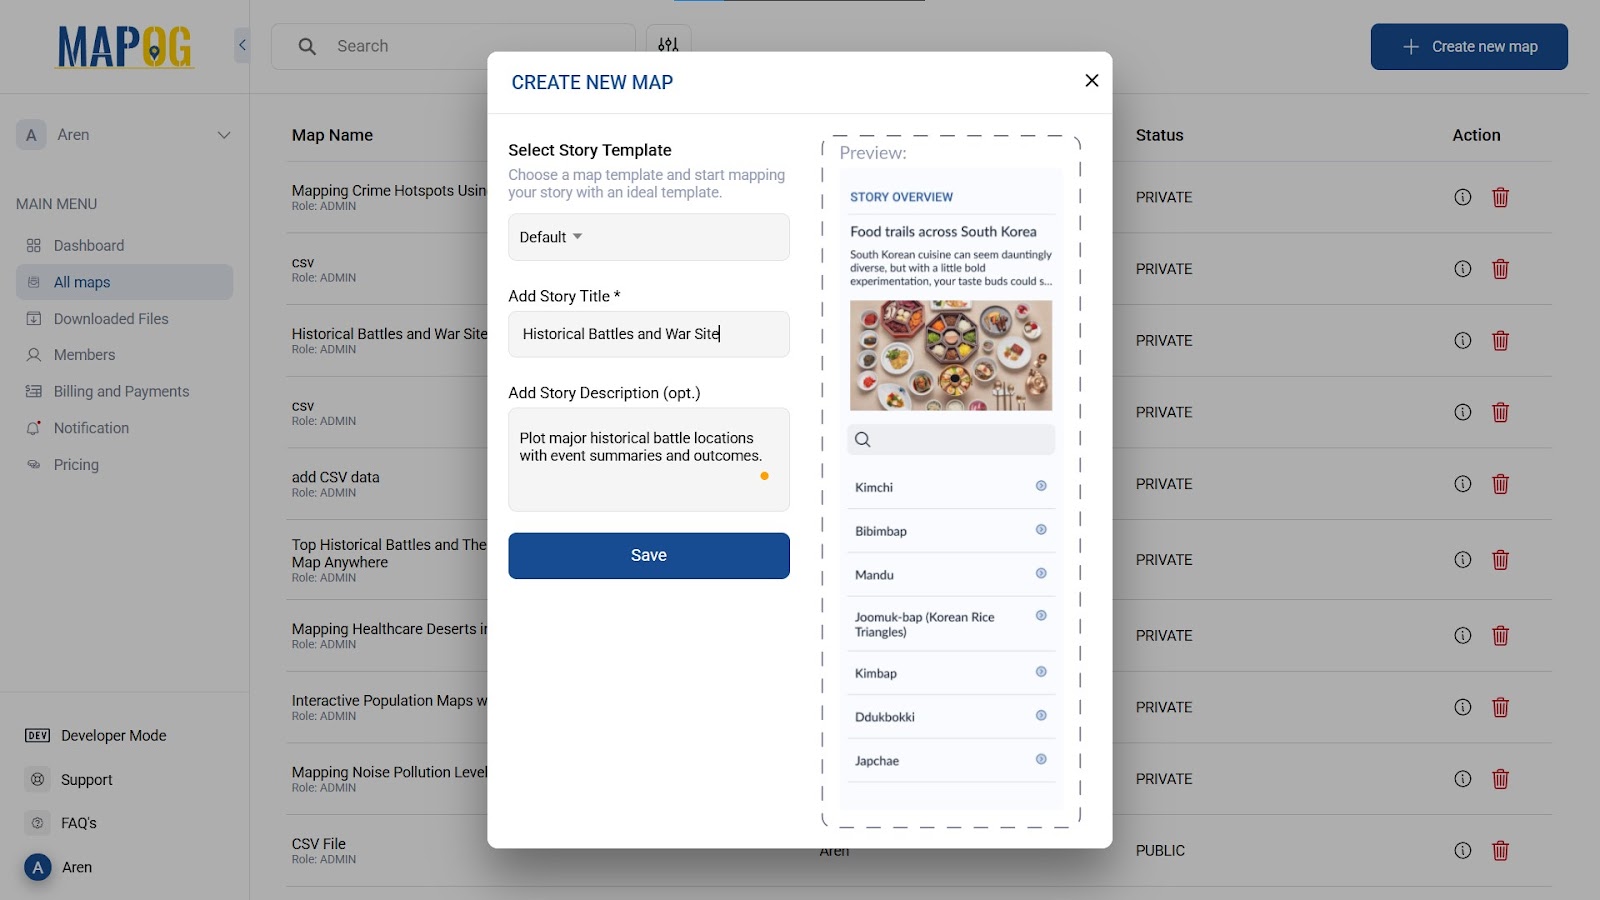
Start by naming your map with impact, like “Major Battles in History: Interactive War Sites with Details.”
Step 2: Plotting Historical War Sites One by One
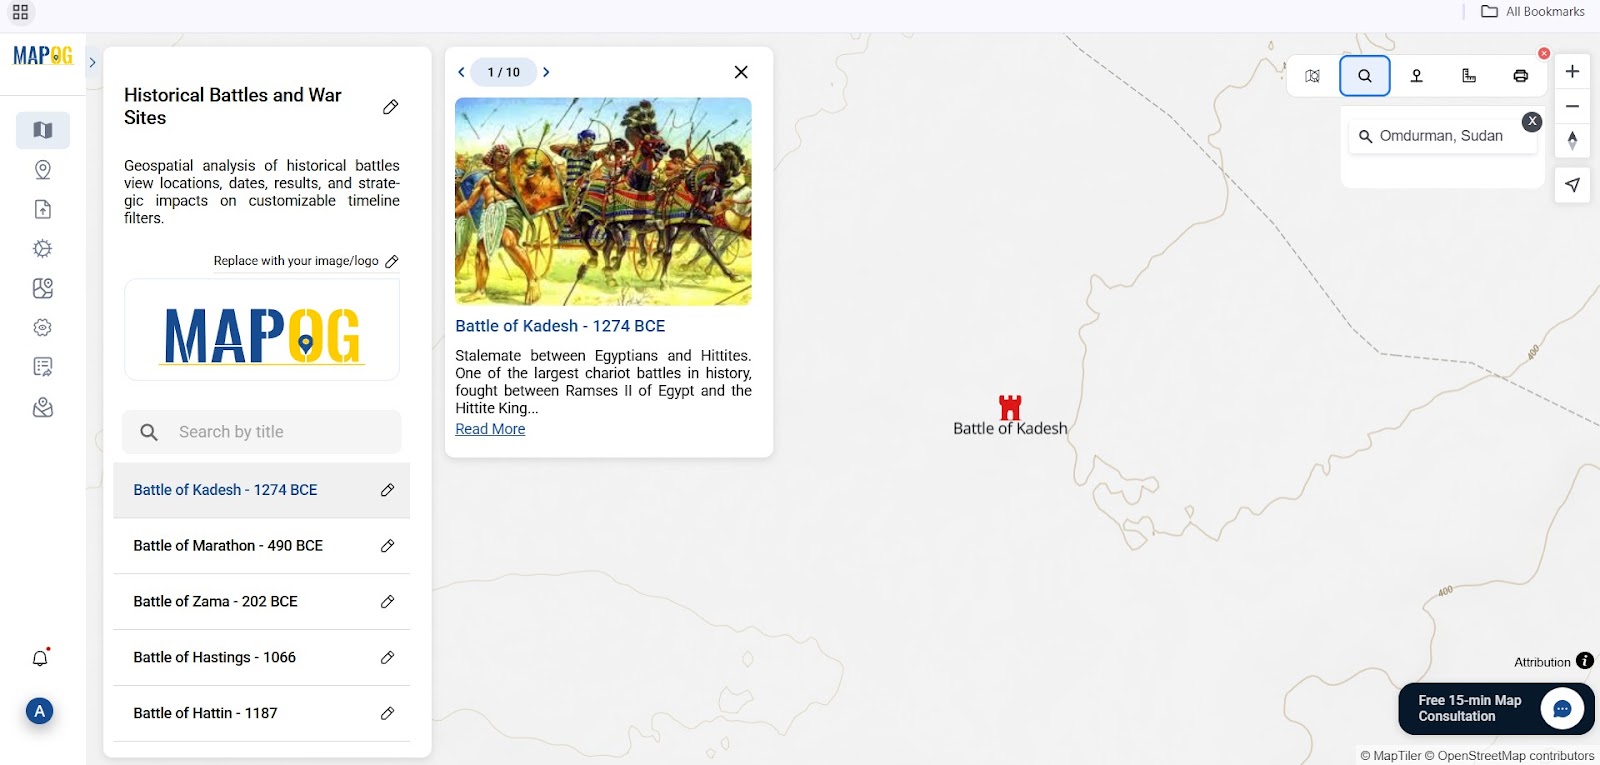
With your map created, it’s time to start adding battles. On the left panel, click “Add Story,” then select Add Point Manually. Start with one historical battle. Then, in the search bar, type and locate. confirm it.
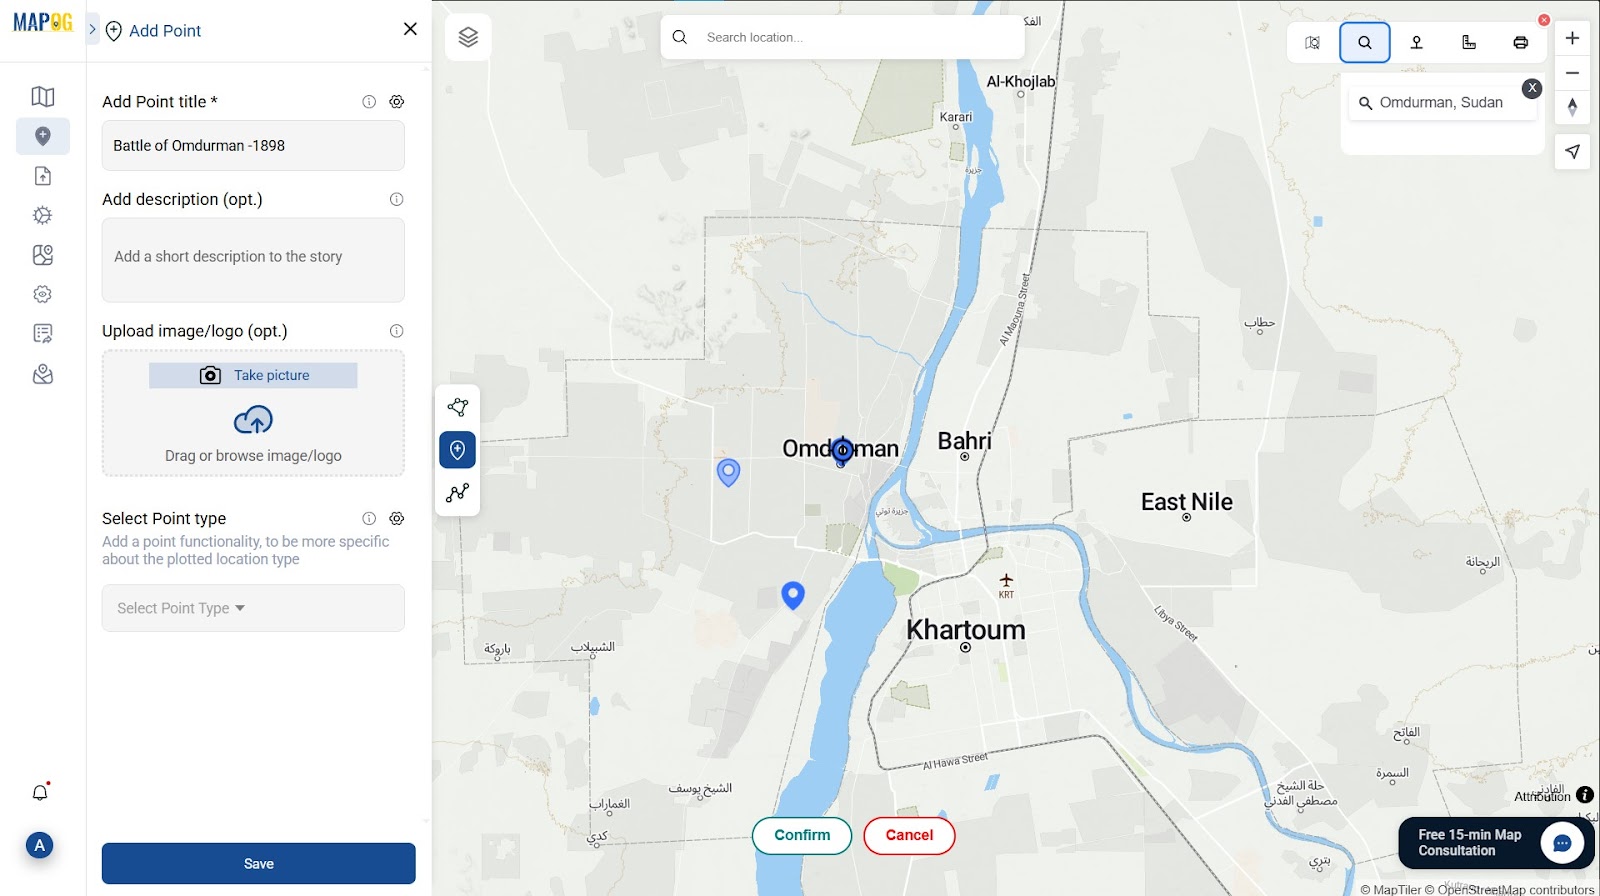
Below that, you’ll see a space for the description. Here, write the year of the battle, its outcome, and a summary. This gives your audience a quick snapshot. If you have an image (like a painting or map of the battle), upload it too. When you’re finished, click Save.
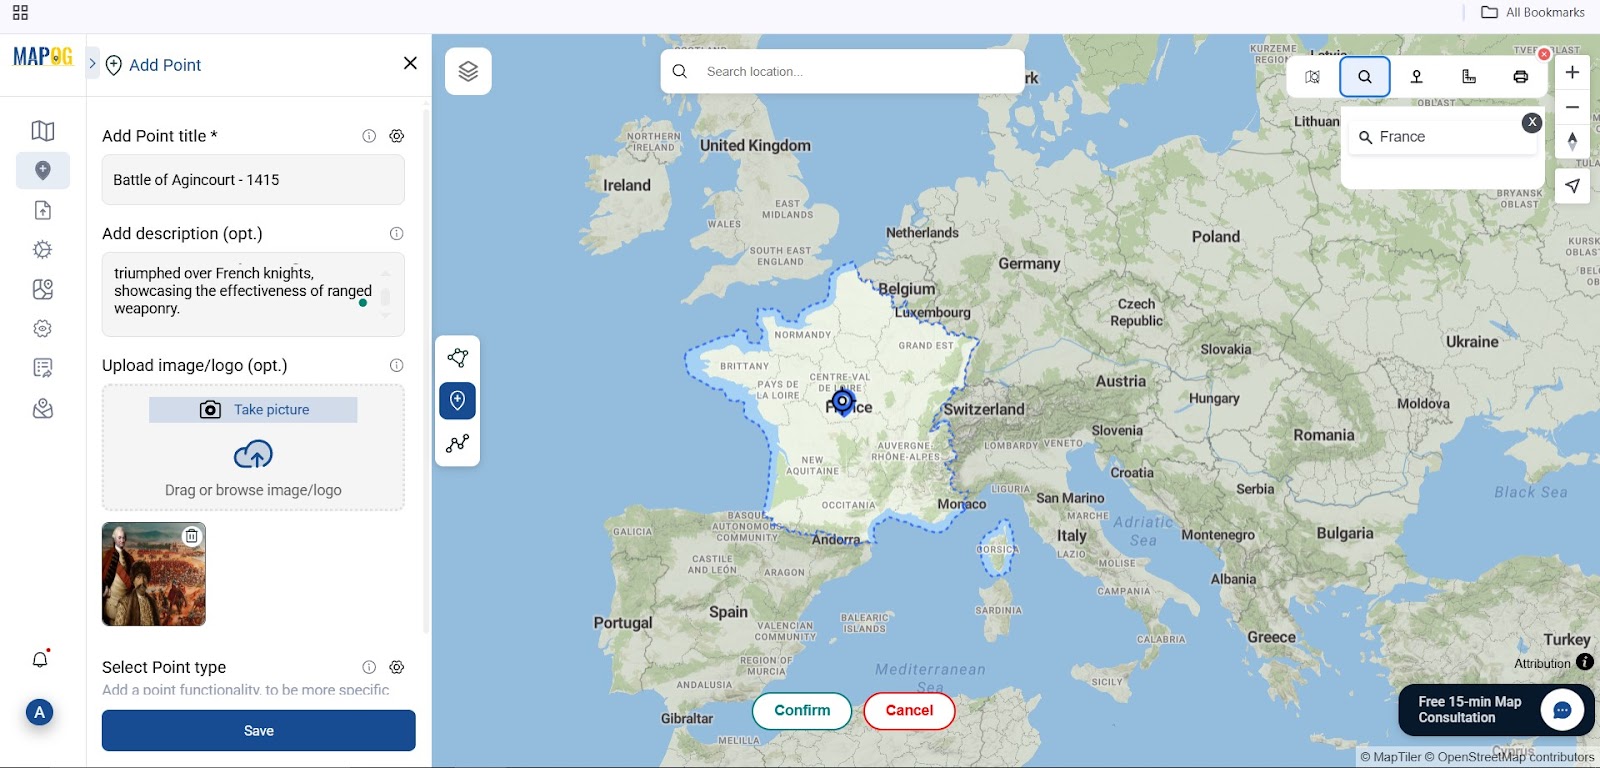
Repeat this process for each battle you want to include—from ancient , medieval to modern
Step 3: Customizing Historical Battle Points for Visual Impact
Once you’ve added a few points, customize them Head to the Edit and click on one of the battle points. Then right click, go to “ point customization “
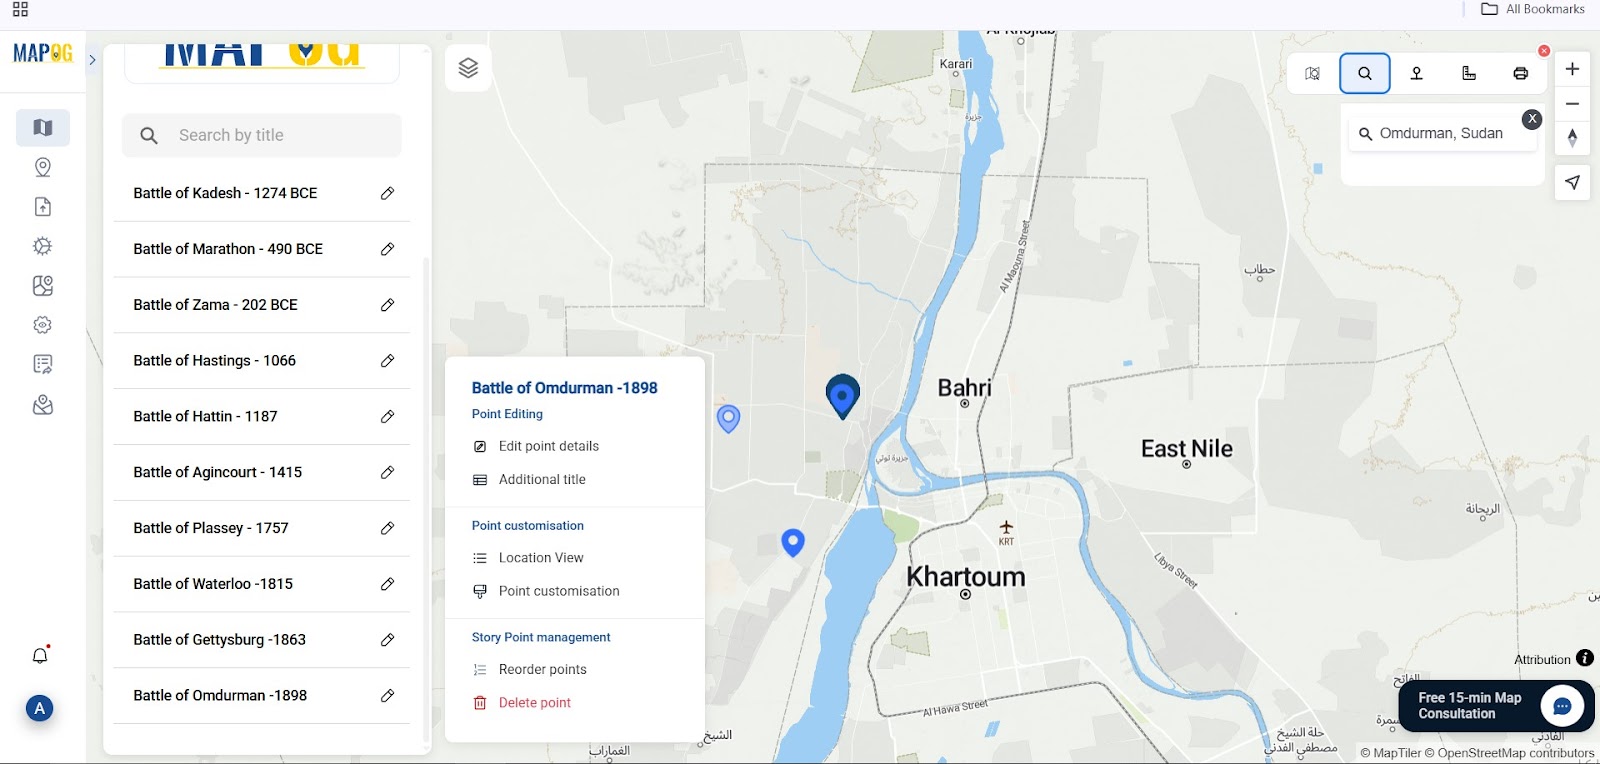
Now choose a symbol for the point, Then, use color to mark which era the battle belongs to. Use Red for Ancient, Blue for Medieval, and orange for Modern battles.
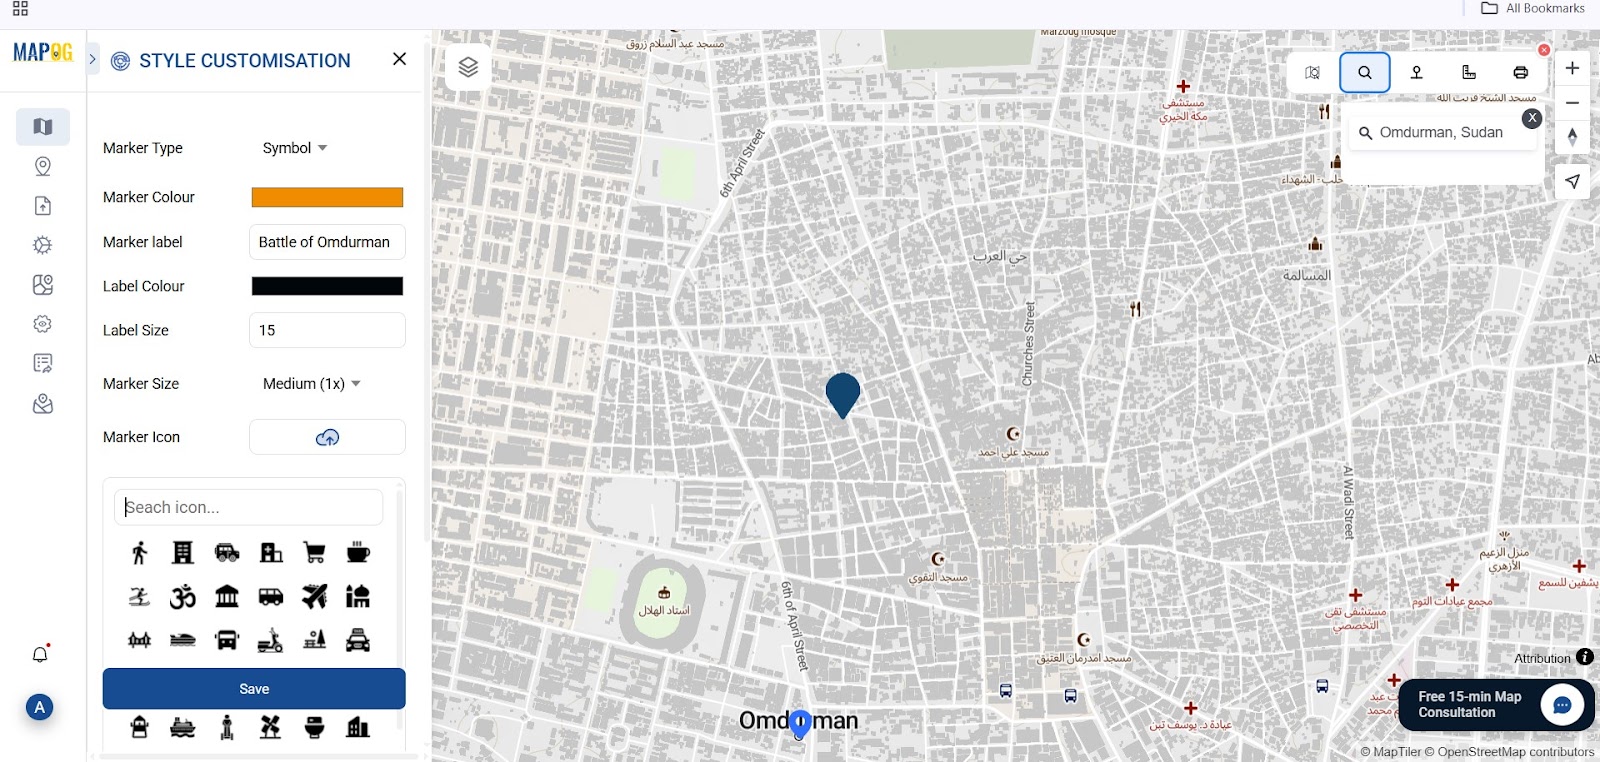
Enhance your map’s clarity by labeling each point with the battle’s name or year and choosing a readable label color. click Save, then repeat for each battle to maintain consistency.
Step 4: Enhancing Your Historical Battles and War Sites Map
With your styled points in place, zoom out to watch history come alive across time and continents.
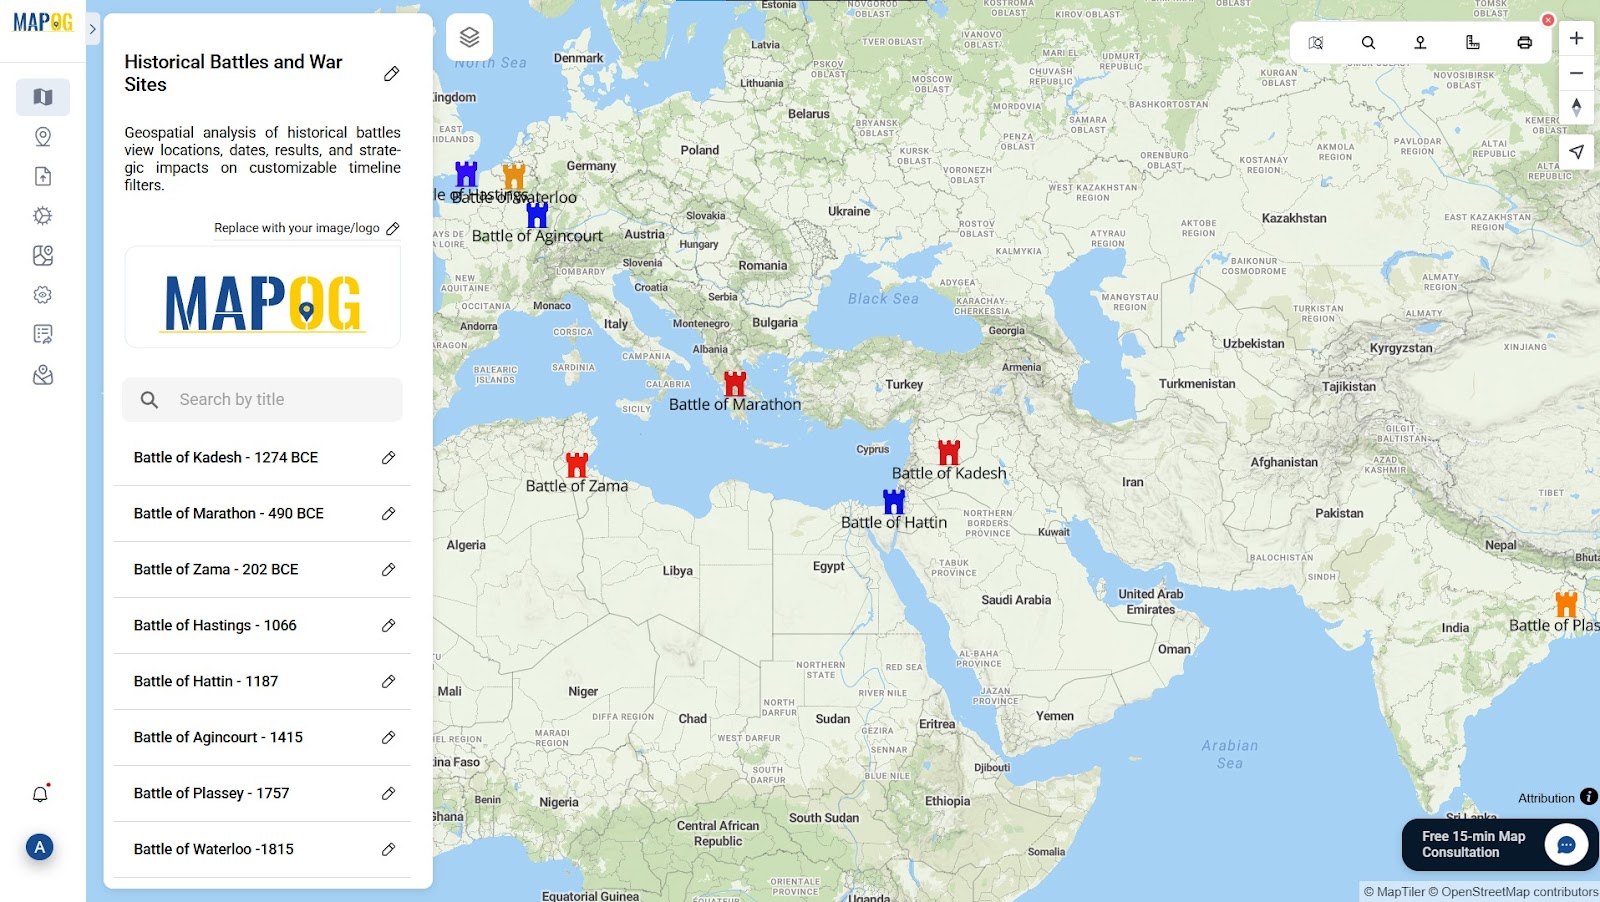
Transform your map’s impact using MAPOG ’s styling tools—change backgrounds, sequence events, and enrich with multimedia for deeper storytelling.
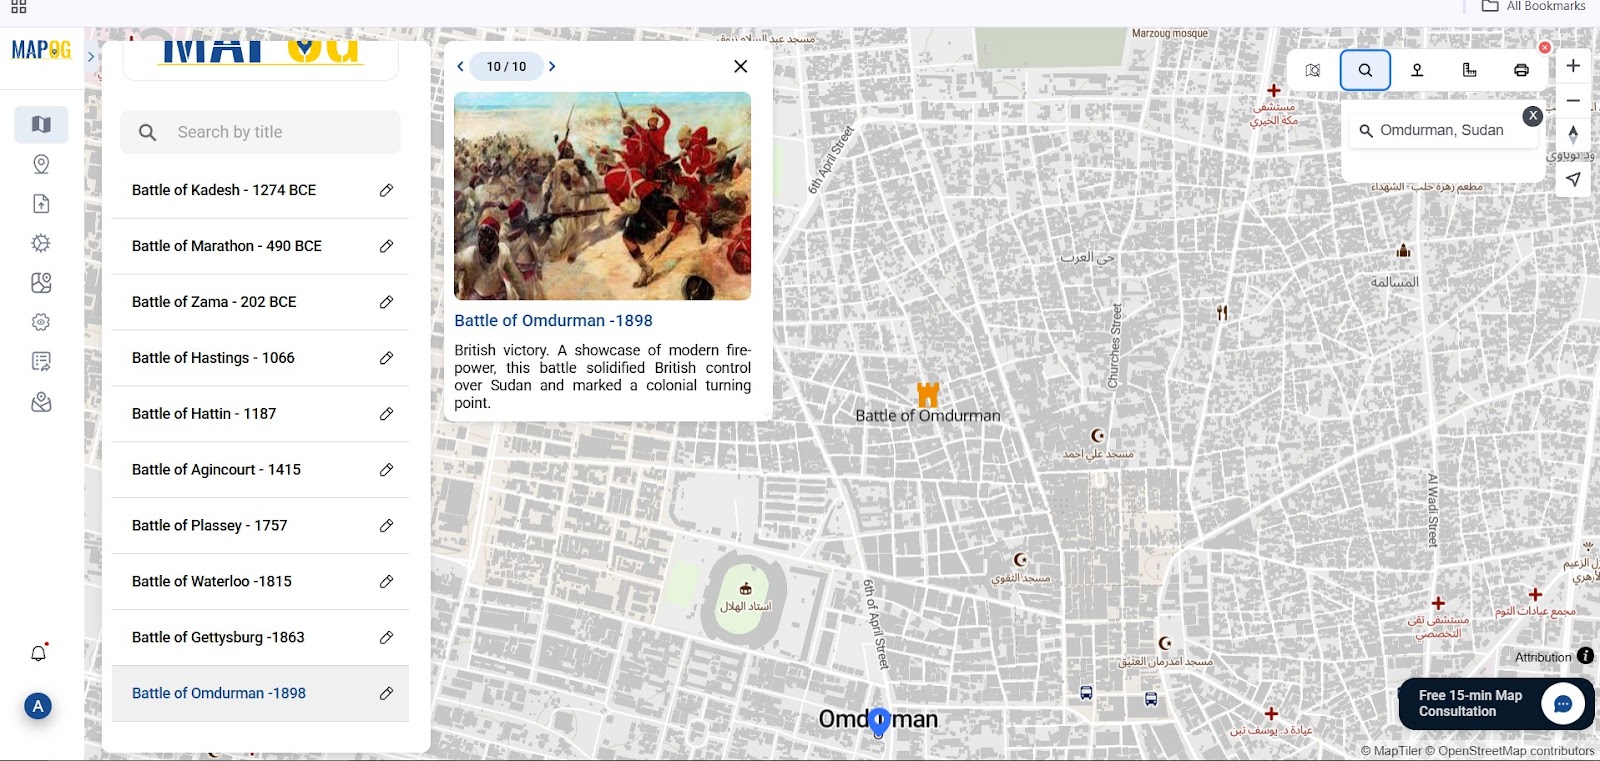
Step 5: Sharing Your Interactive War Sites Map
Once your story map is complete, hit Save and instantly share your interactive timeline with the world via link or embed.From classrooms to blogs, your map transforms static history into a living, location-rich journey that anyone can explore and learn from.
Why Use MAPOG for Mapping Historical Battles and War Sites?
MAPOG empowers students, teachers, and researchers to effortlessly create interactive historical maps—no coding needed. With color-coded styling and visual labels, your story becomes clear and engaging. Add images for richer context, place battles with geographic precision, and share instantly for impactful presentations and immersive learning.
Conclusion: Turning History into a Visual Journey
Mapping historical battles with MAPOG transforms history into an interactive journey, mapping battles across time and terrain.
From ancient clashes to modern wars, it brings the past alive through place.
No more memorizing—your story map becomes a living archive of conflict and resilience.
Let geography redefine how we experience history.
Explore more blogs :
How GIS Use soil mapping and crop monitoring,
Using GIS for smart city planning : From traffic management to green spaces
Role Of GIS in Irrigation Planning Using Water Resource Management