Adding story points and narratives to your map transforms it from a simple visual into an interactive story. Rather than displaying locations, you connect each point with details like descriptions, photos, etc. MAPOG, provides 3 easy ways to add story points making it easy and flexible; you can do it by uploading Excel or CSV files, adding points manually, or through the point library.
Key concept: Adding story points and narratives to your map
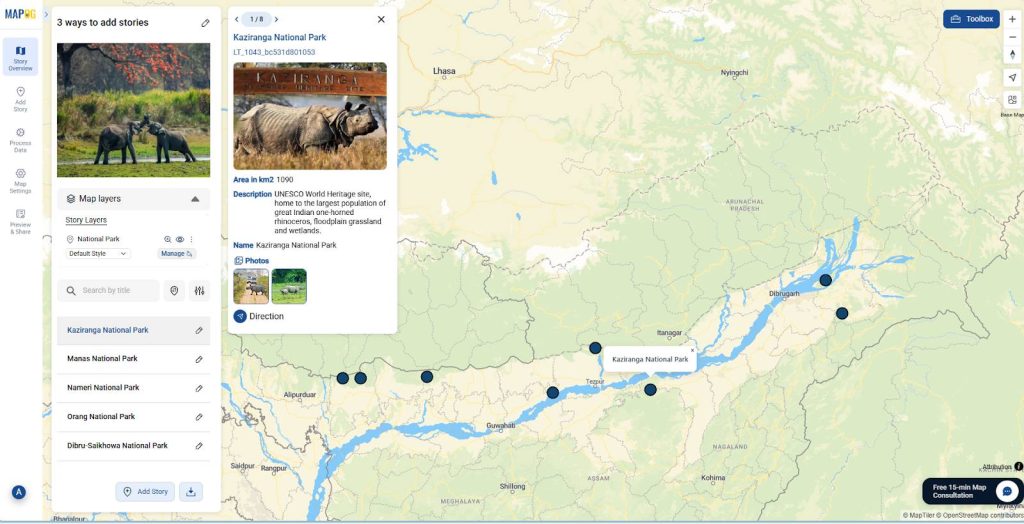
The key concept of adding story points and narratives is to seamlessly combine data with storytelling in a visual way. Each point on the map becomes a short chapter with images, descriptions, and details that guide viewers through the story. For professionals like event planners or designers, it transforms maps into living portfolios where people can experience the story behind every location.
Step-Step-By-Step Process to Add Story Points and Narratives to Your Map
In this guide, we’ll explore 3 easy ways to add story points and narratives to your map.
Adding story points and narratives manually
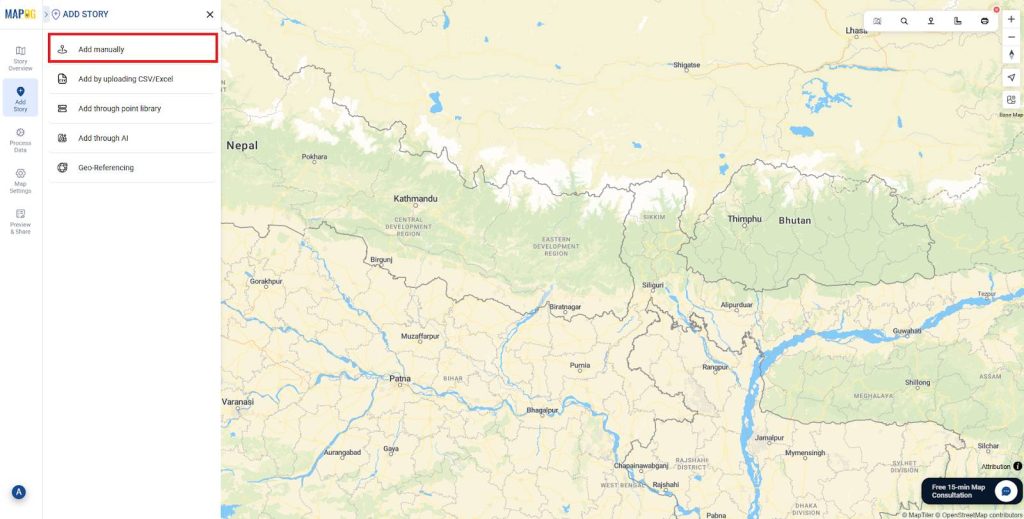
1. First, log into MAPOG & create a new map. Go to Add story then click on Add manually.
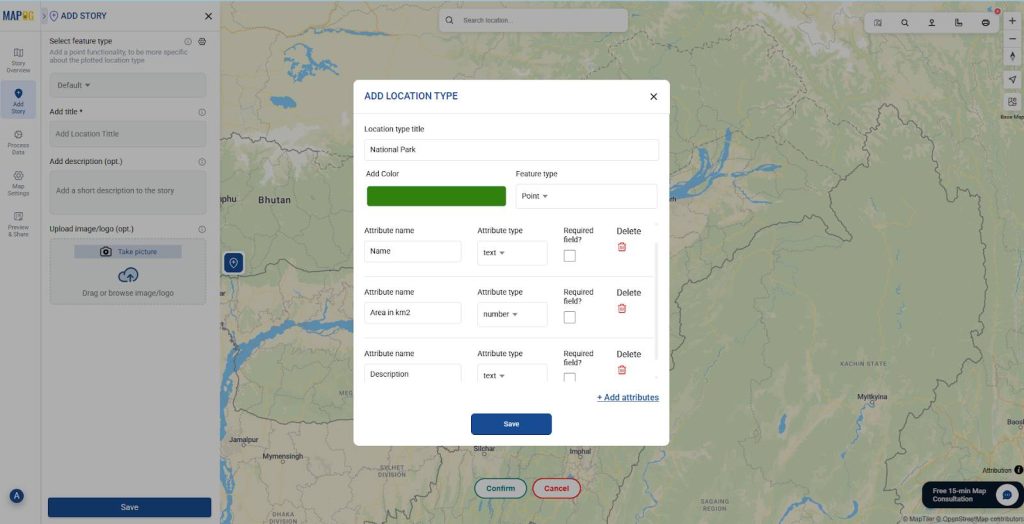
2. Create a new feature type, click on the settings icon next to select feature type. Go to “add more location type”. Give a suitable title to your new location type and select a feature type (e.g., Point) add attribute fields you want to showcase and save.
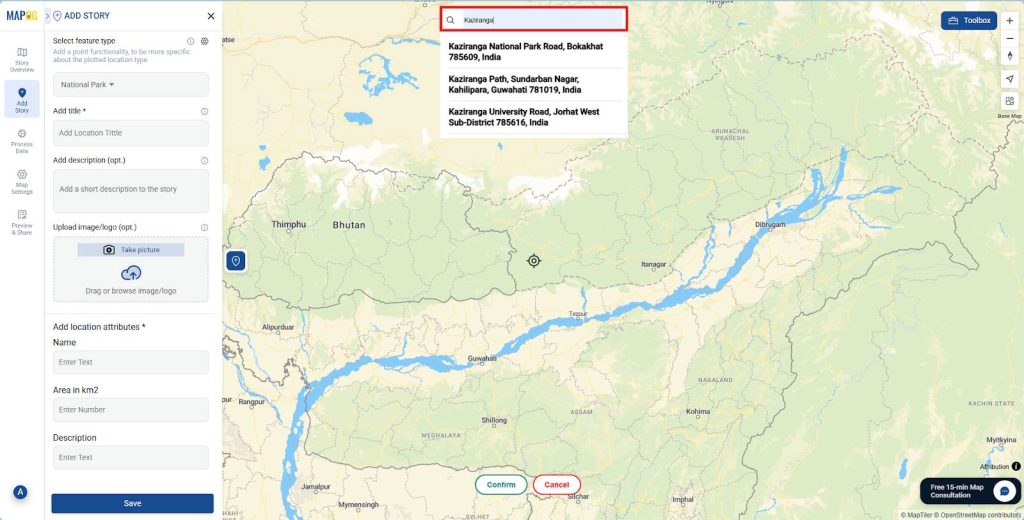
3. Select the feature type from drop down, then go to the search box at the top and search for your location. Alternatively, go to the toolbox and you can search using coordinates. Then confirm your point.
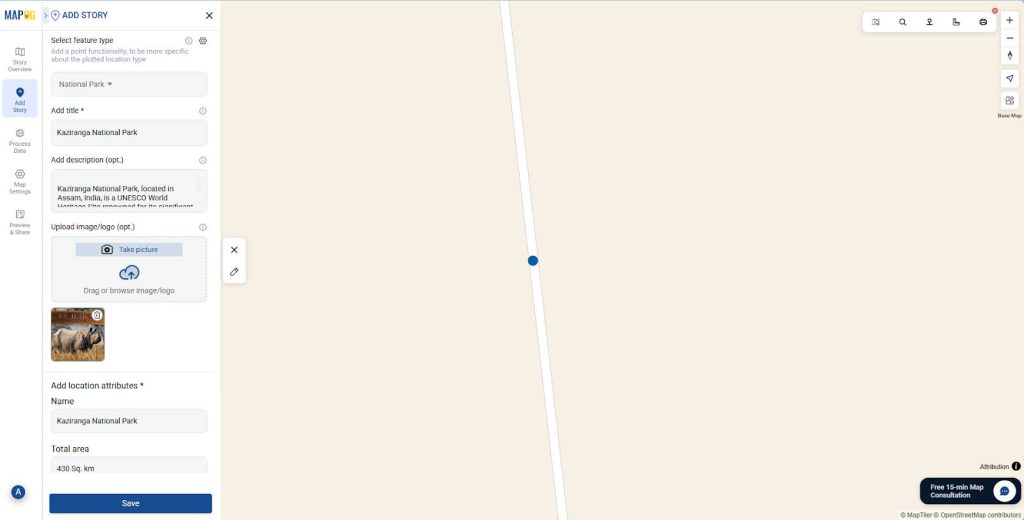
4. Now fill in attributes like name and description, images, then click Save to add story points and narratives manually.
Adding story points and narratives by uploading CSV/Excel
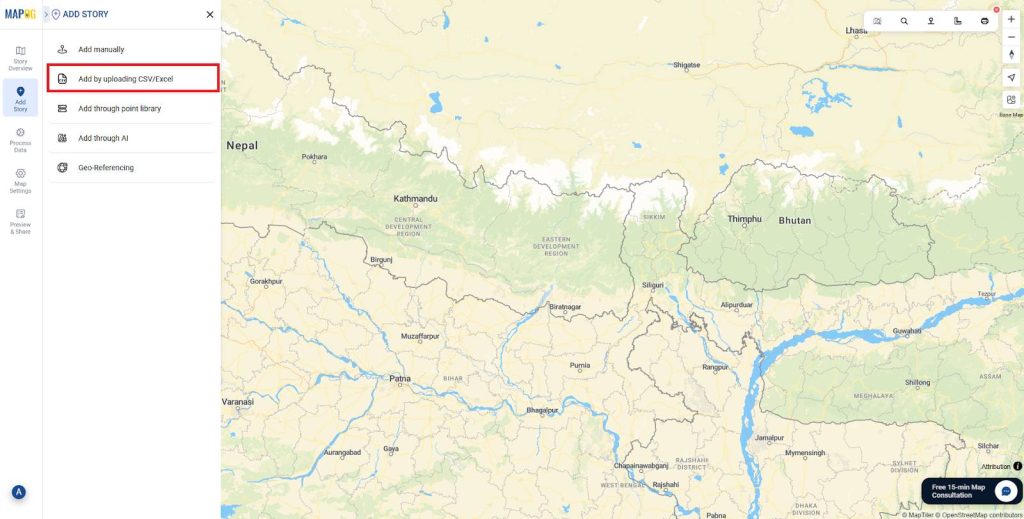
1. To add story and narratives by uploading CSV/Excel, firstly go to Add story then choose Add by uploading CSV/Excel.
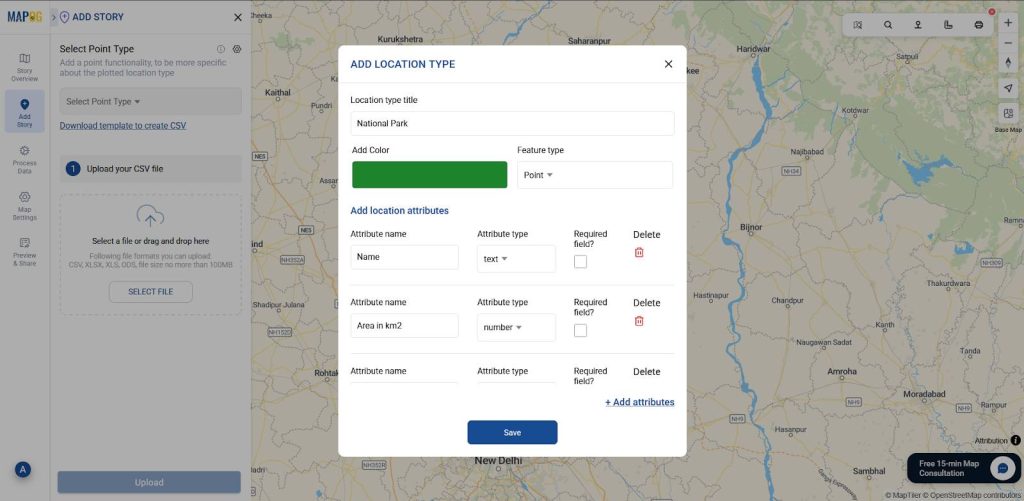
2. Now create a new point type, click on the settings icon near select point type then click on “add more location type”. Give a suitable title to your location type and select a feature type (e.g., Point) add attribute you want to showcase.
3. Then select the point type you created and upload the prepared excel or CSV file, make sure the uploaded file has latitude and longitude columns. Now, match all the attribute values to the columns of your excel file and select Latitude & Longitude as field type and match latitude and longitude columns.
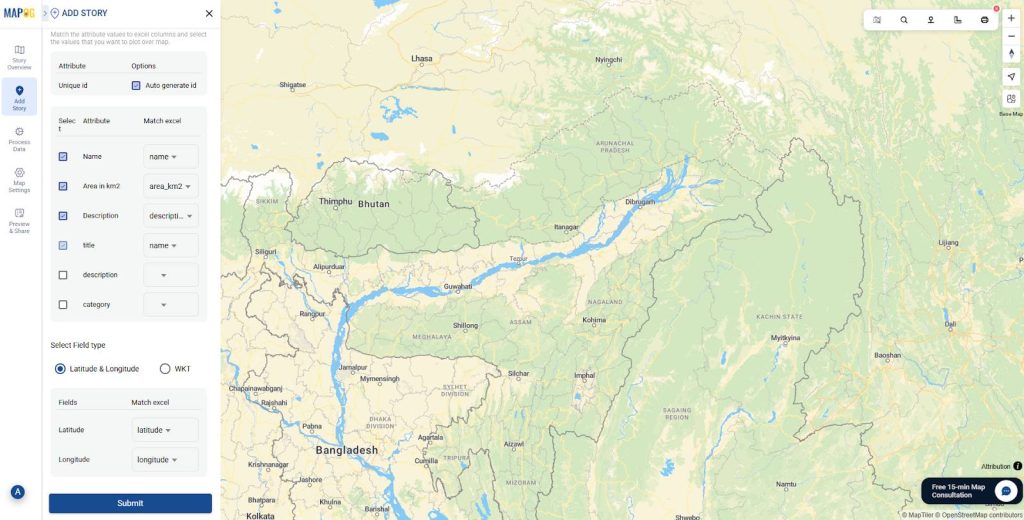
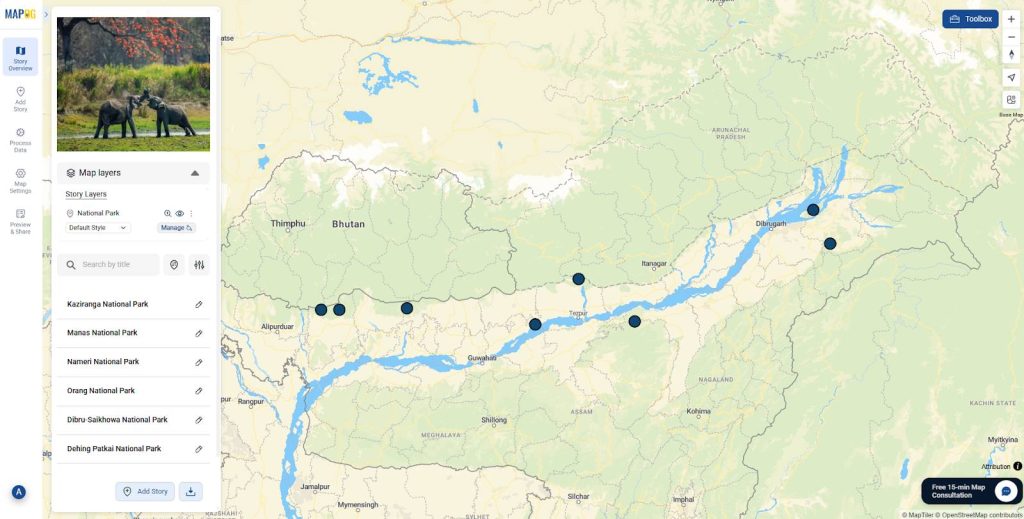
Then click on upload, points will instantly show up on the map.
Adding story points and narratives through point library
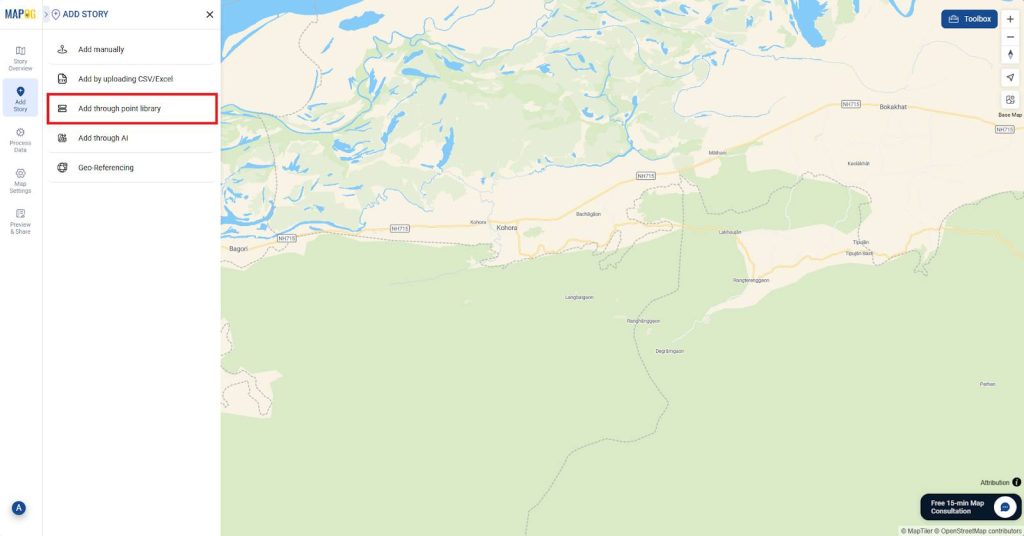
1. To add story points and narratives through the point library, first go to Add story and choose Add through point library, then it will take you to the point library with different feature types. Adding through point library is limited to existing datasets only.
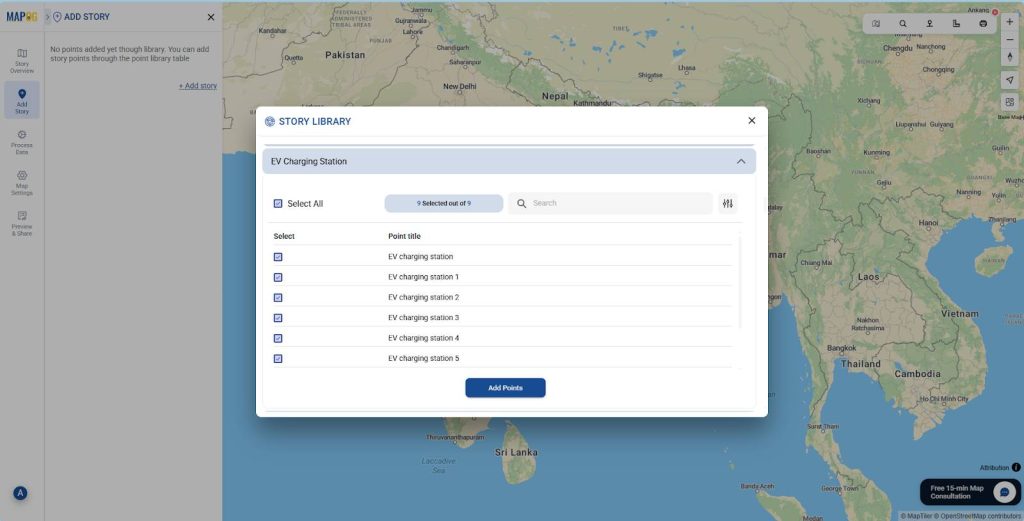
2. Now locate your desired feature type and click. Then select points that you want on your map. Then click on Add points.
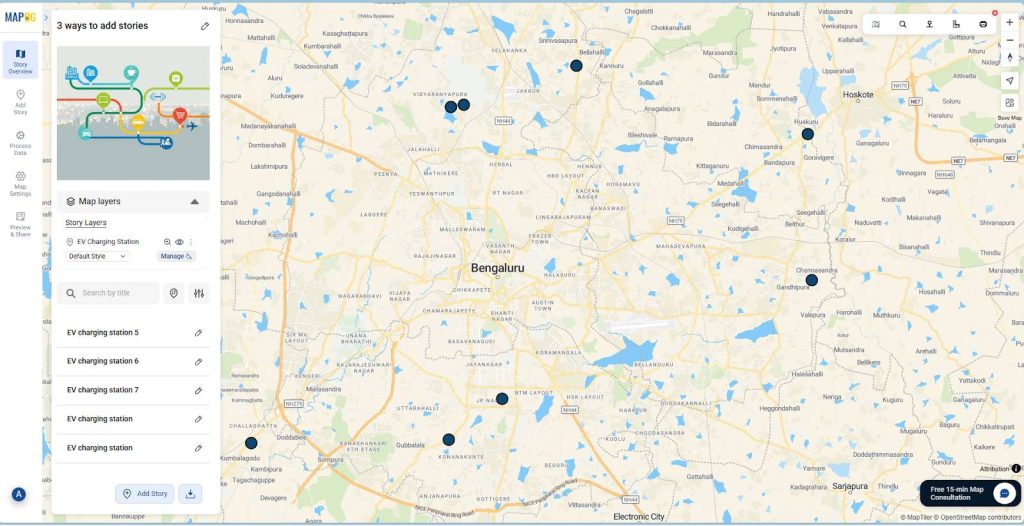
This way you will be able to add story points and narratives with all the attributes through the point library without any hustle.
Industries and domains benefitting
- Event planners: Showcase past events with photos, themes, and highlights to build trust and credibility.
- Travel agencies: Create interactive itineraries that display destinations, experiences, and routes with visuals.
- Interior designers: Present project sites with design concepts, progress updates as a part of portfolio.
- Real estate professionals: Tell the property developments, upcoming projects through interactive maps.
Conclusion
In conclusion, by adding story and narrative to your map, you turn ordinary data into a visual experience. Instead of simply marking locations, you guide viewers through meaningful journeys that connect places with purpose. Moreover, MAPOG makes this process straightforward with 3 easy ways to add story points and narratives.
Here are some other blogs you might be interested in
- How to Upload and Visualize CSV Data on a Map
- Mapping Water ATMs and Community Taps for Equitable Access to Clean Drinking Water
- How to Map Waste Bins, Collection Points & Recycling Centers to Improve Waste Management and Sustainability
- How Interior Designers Can Manage Projects On-Map, Not on Spreadsheets