As biodiversity faces unprecedented loss, conservationists are using advanced mapping technology to fight back. Geographic Information Systems (GIS) have evolved into powerful tools for wildlife monitoring and protection, enabling teams to plan migration corridors, predict poaching hotspots. This technology is empowering rangers and researchers to make faster, smarter decisions, helping reverse biodiversity loss.
Key Concept of GIS for Wildlife Monitoring and prevention
The essential elements of using GIS have played a vital role in wildlife conservation by enabling data-driven decision-making, monitoring, identifying risks from human settlements, monitor habitat changes and predictive threat prevention by using MAPOG which emphasize on data visualization, customizing layers and collaborating with teams. This article will provide you with a detailed process on how to use GIS for wildlife monitoring and preventing threats.
Below are the steps that make GIS indispensable for monitoring wildlife:
Step 1: Access MAPOG GIS Platform
- Log in to your account on the MAPOG website
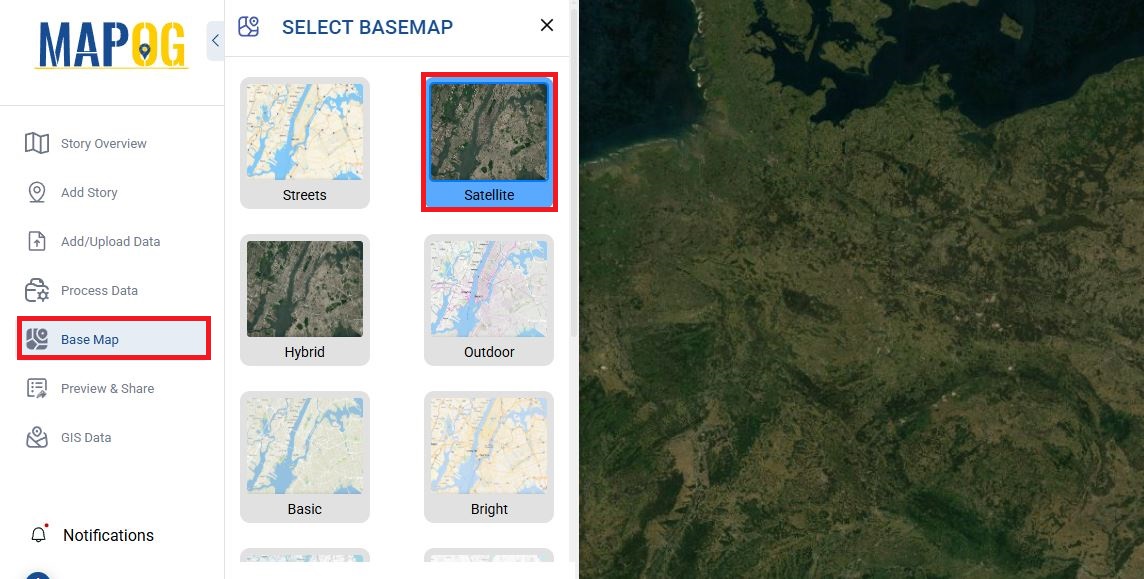
- Choose a high-resolution Basemap (Satellite or Hybrid) for reference.
Step 2: Import or Upload Your GIS Layers
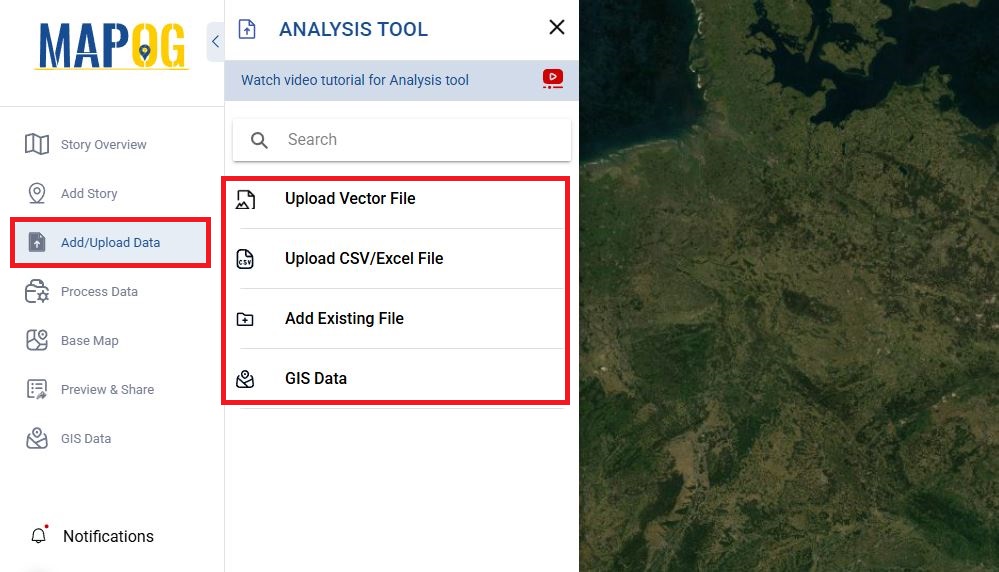
MAPOG has built in GIS Data for a variety of layers for various countries from points, polygons to line or either import your data from the “Add/Upload Data” which supports vector file, csv/excel file.
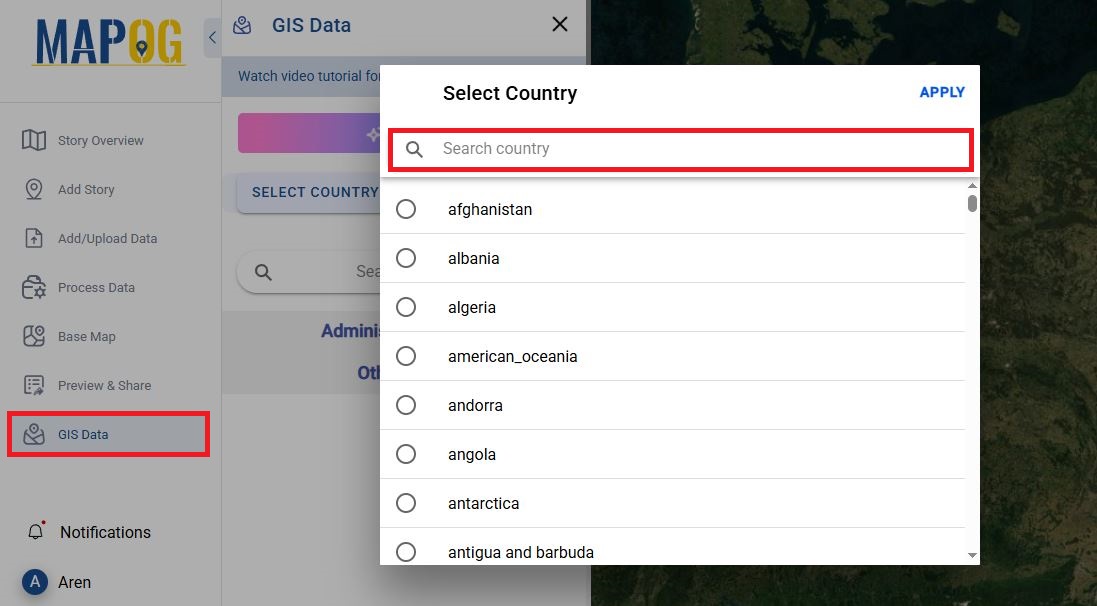
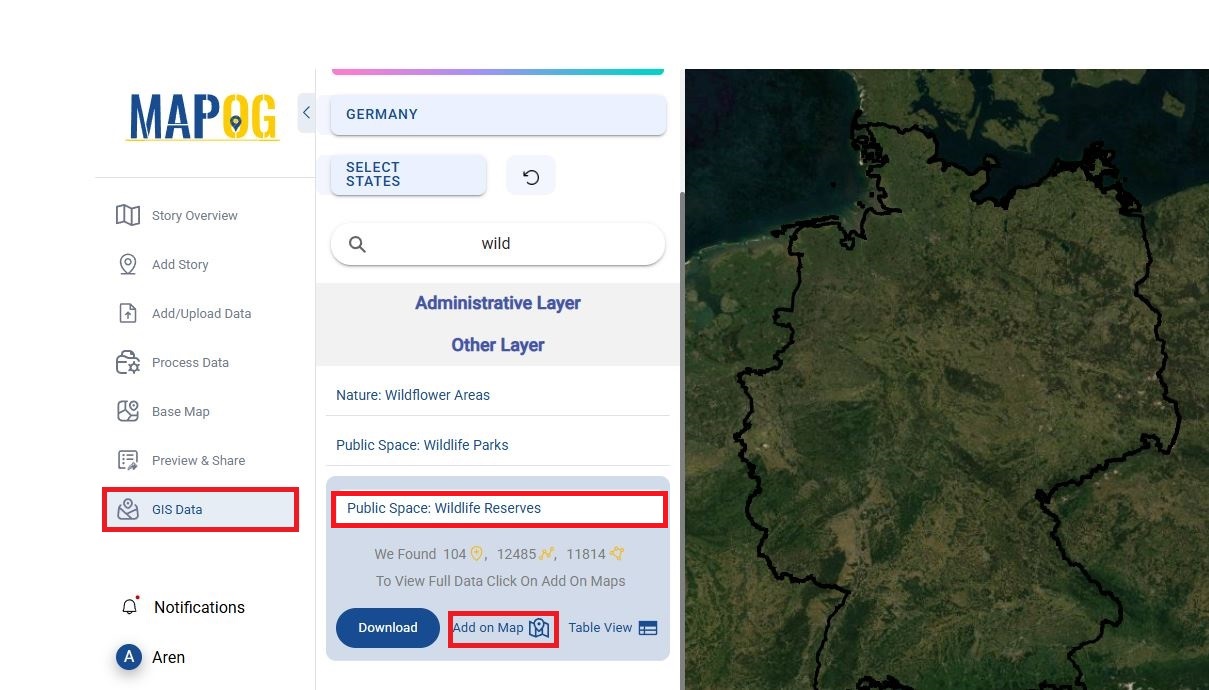
- Upload your data into MAPOG by clicking on the GIS Data button.
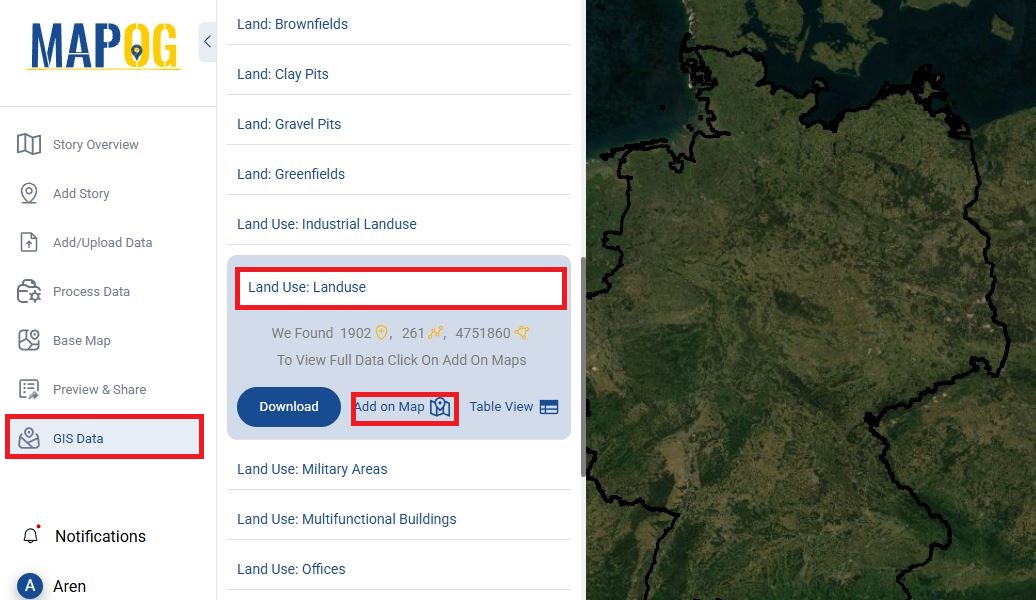
- Search for country and form the other layer search for layers and click on ‘add to map’
- Add “wildlife reserved area” and “land use/land cover”
Step 3: Apply Style for Visualizing Data
Once your layers are successfully added to the MAPOG platform, it’s time to enhance your visualization to make the data easier to interpret. This can be done by applying a custom style to each layer. Here’s how to style the layers for better data visualization:
- Access the Style Editor
After adding the layers, you’ll want to access the Style Editor. This is where you can customize how the data appears on the map, making it easier to distinguish between different areas and categories. - Choose Category Style for Wildlife Reserved Areas
For wildlife reserved areas, you can use the Category Style to differentiate polygons by their categories. In the Style Editor, you can adjust the colors and icons associated with each category to make them stand out visually on the map.
Tip: Choose vibrant and contrasting colors to make each protected area easily distinguishable.

- Use Heat Map Style for Land Use/Land Cover
For analyzing land use or land cover, the Heat Map Style is an excellent choice. A heat map style shows areas of varying density with different color gradients, making it easier to identify regions of high and low activity or coverage.

Step 4: Analyze and Monitor Data
Once you’ve visualized your layers and applied relevant styles, the next step is to analyze the data to derive actionable insights.
- Identify Critical Areas for Conservation:
By comparing wildlife reserved areas with land use/land cover data, you can identify potential threats to protected habitats, such as encroachment from agricultural activities or urban development. Use the heat map to pinpoint areas with higher risks.
Step 5: Share and Collaborate
After analyzing your data and deriving insights, MAPOG makes it easy to share your findings with colleagues, researchers, or conservationists.
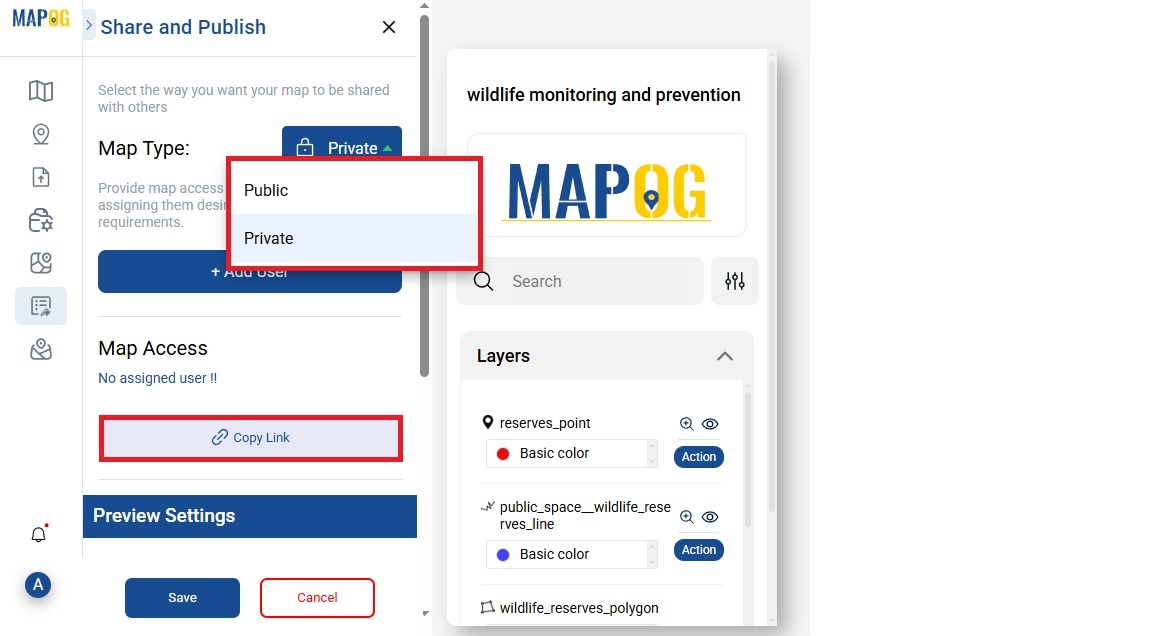
- Export and Share Maps:
You can preview and share your visualized maps as image files or interactive map links. Share or export and use them in reports, presentations, or publications to communicate your findings.
Key Domains in GIS for Wildlife Monitoring
- Wildlife Movement Tracking
- Industry: Conservation, Research, Environmental Science. Using GIS tools for monitoring wildlife animal movement and helps Optimizing Forest Management with GIS: Grid-Based Analysis for Sustainable Conservation and migration patterns in real-time.
- Industry: Conservation, Research, Environmental Science. Using GIS tools for monitoring wildlife animal movement and helps Optimizing Forest Management with GIS: Grid-Based Analysis for Sustainable Conservation and migration patterns in real-time.
- Habitat Monitoring and Protection
- Industry: Forestry, Agriculture, Environmental Management
GIS tools allow users to map and track critical habitats, including protected areas and wildlife corridors. These technologies help to understand Forest Distribution and protecting wildlife.
- Industry: Forestry, Agriculture, Environmental Management
- Poaching Prevention and Surveillance
- Industry: Law Enforcement, Security, Conservation. GIS technology enhances surveillance, enabling authorities to identify areas with high poaching risk and Analysis for Habitat Range Mapping responds promptly. By analyzing trends in illegal activities and monitoring protected zones, GIS plays a vital role in preventing poaching and safeguarding endangered species.
GIS Data Used for Wildlife Monitoring and Prevention
Wildlife reserved area Data
Land use/land cover Data
Boundary Area
Conclusion
By using GIS tools for Wildlife monitoring and prevention are crucial as species face increasing threats from human activities, climate change, and habitat loss. MAPOG’s GIS platform empowers conservationists to track animal movements, monitor habitats, identify conflict zones, and prevent poaching, making wildlife protection more precise and efficient. By leveraging GIS technology, we can make data-driven decisions, create effective conservation strategies, and ensure a sustainable future for wildlife. Adopting platforms like MAPOG helps protect species while promoting a balanced coexistence between wildlife and humans.
Explore Other Blog
District-Wise Disability Population Analysis Using Heat Maps | Easy Insights & Mapping
Optimizing Warehouse Location Selection with GIS for Supply Chain Efficiency
Role of GIS In Irrigation Planning and Water Resource Management
Using GIS for Smart City Planning: From Traffic Management to Green Spaces