Groundwater mapping using GIS tools is becoming essential as groundwater decline and recharge gaps raise serious concerns—especially in regions that rely heavily on underground water resources. Fortunately, by using GIS technology, stakeholders can now visualize, Role of GIS In Irrigation Planning and Water Resource Management to these changes more efficiently than ever before.
Moreover, with the help of location intelligence, decision-makers can accurately identify, Mapping Groundwater Concentration with Heat Maps ,strategise targeted conservation efforts, and promote long-term water sustainability. As a result, these tools are transforming the way we manage groundwater at local and regional scales.
Key Concepts in Groundwater Mapping Using GIS Tools
To create an effective and reliable groundwater map, it is important to understand several key elements.
Water Level Change Analysis with GIS
First, track the variation between pre-monsoon and post–monsoon groundwater levels.
Identifying Recharge Gaps Through Mapping
Next, locate zones where natural recharge from rainfall or surface water is insufficient.
Mapping Decline Zones for Targeted Action
Then, use GIS data to reveal areas where groundwater tables have been falling steadily.
Groundwater Mapping Using GIS Tools: A Step-by-Step Guide
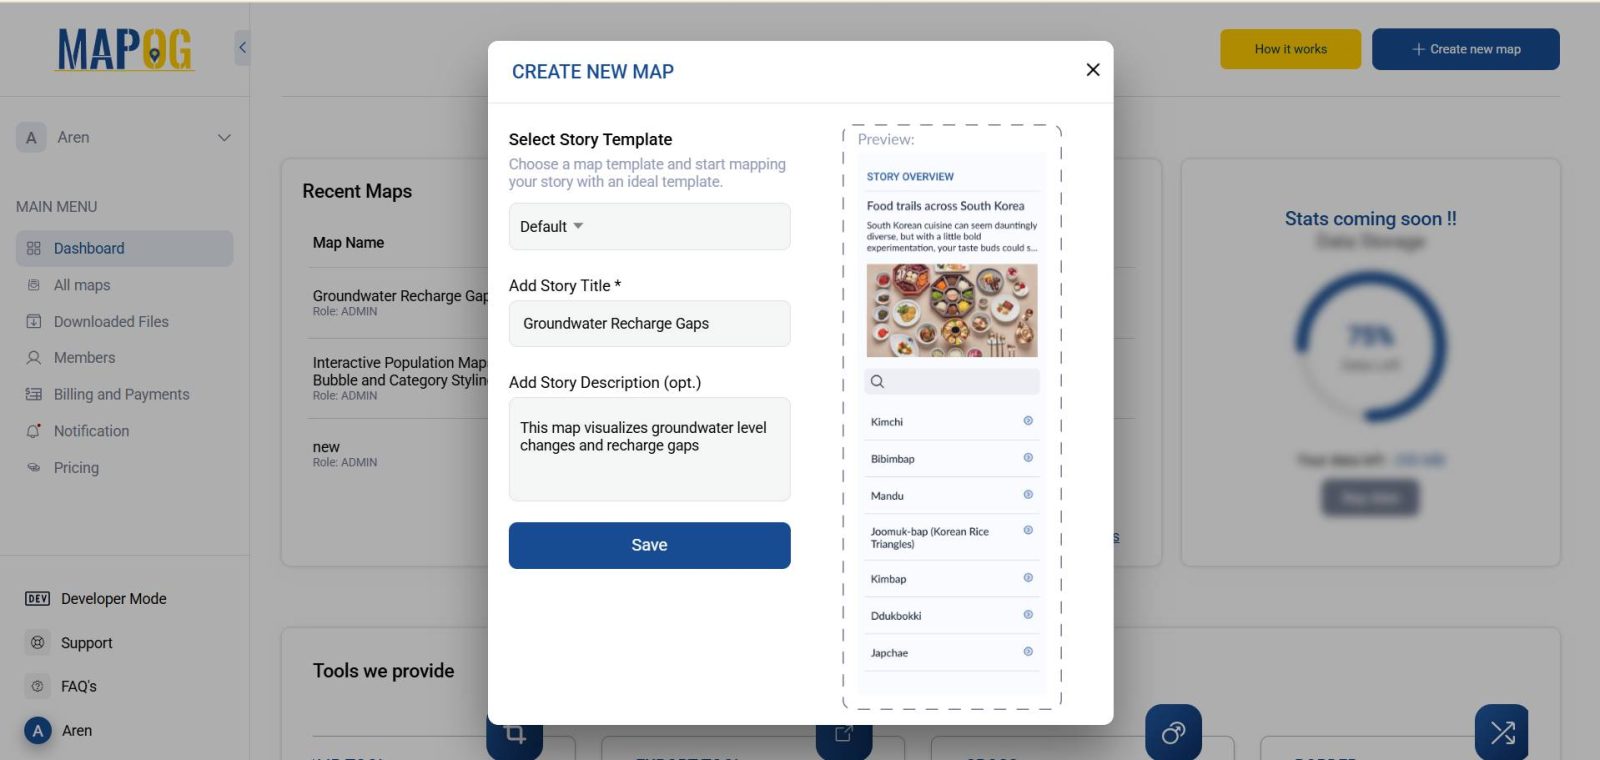
1: Create a new map
- Go to Mapog
- create a new map by clicking on new story
2- Prepare Groundwater Data
Compile your data in Excel with the following columns:
- Location Name
- Latitude & Longitude
- Pre-monsoon Water Level (m)
- Post-monsoon Water Level (m)
- Calculated Water Level Change (Post – Pre)
- Status (Decline, Stable, Recharge Gap)
2: Upload and Visualize
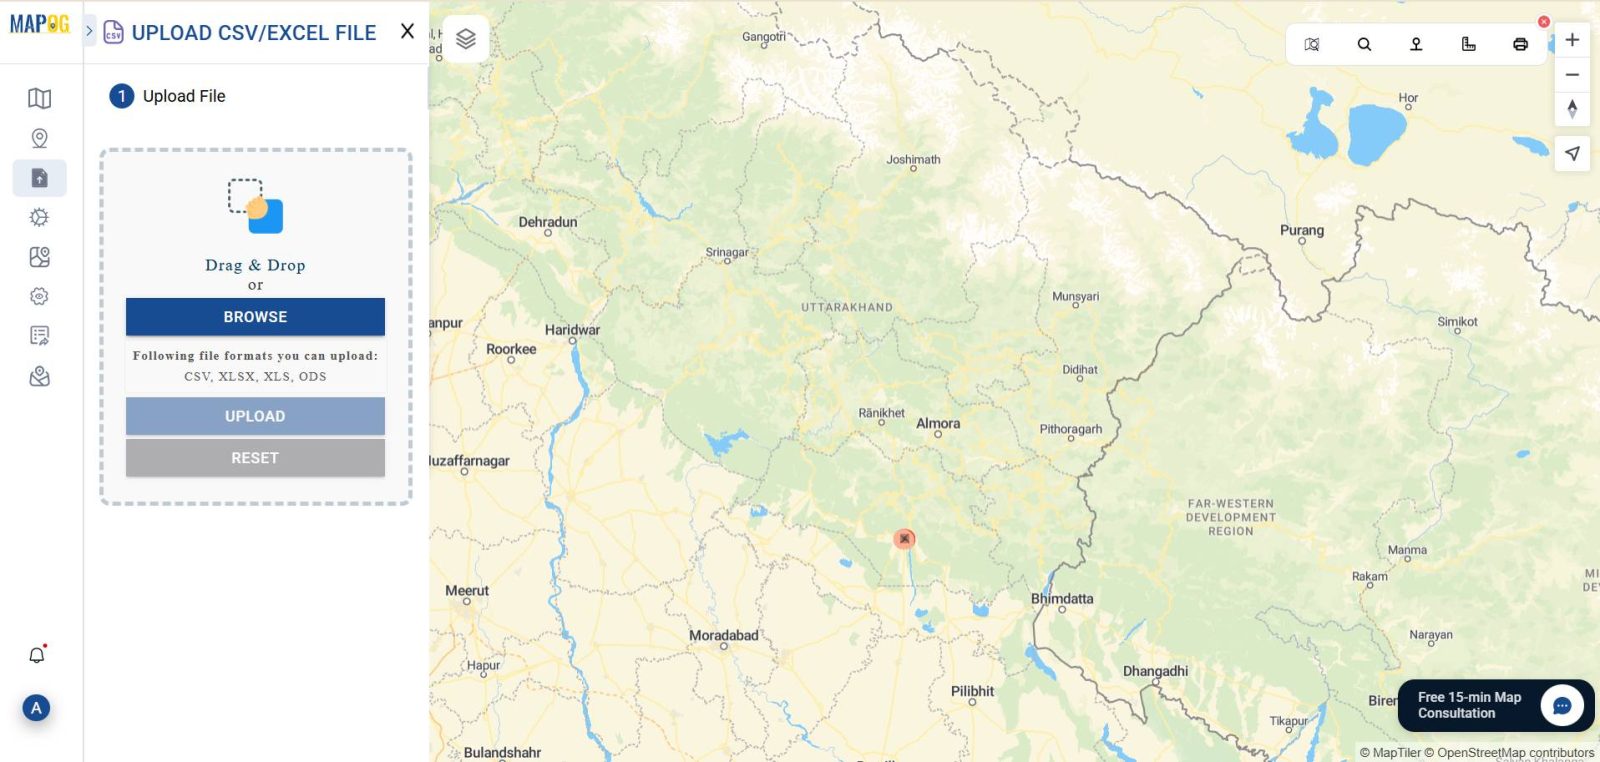
- Click on Add/Upload Data > Upload CSV/Excel
- Upload your Excel file.
- Map Latitude and Longitude fields.
- Add a base layer such as district boundaries by using GIS Data.
3: Applying Color Maps in Groundwater Mapping Using GIS Tools
- Apply Color Map for Water Level Change
First, navigate to Style Layer → Color Map and select the"Water_Level_Change_m"column. Then, apply a blue-to-red gradient. - Analyze Recharge Zones Around Water Structures
4: Creating Buffer
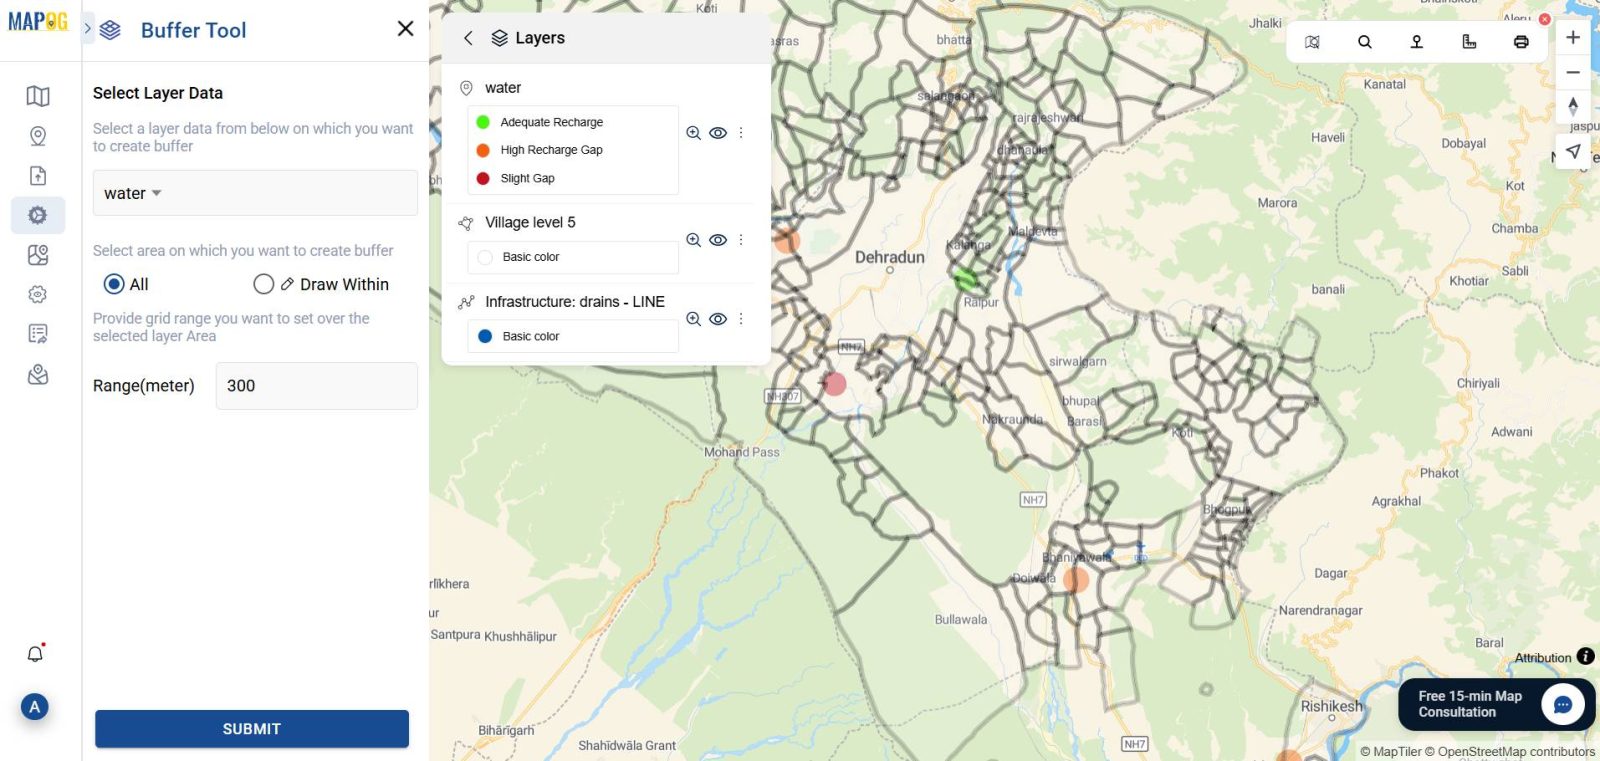
- Next, use the Buffer Tool to draw a 300-meter buffer zone around ponds, check dams, or water tanks. In the buffer tool settings:
- Choose the water structure layer as your input layer.
- Set the buffer distance to 300 meters (or any distance based on your analysis needs).
- Choose a color and transparency level for the buffer area.
- Give the buffer layer a name like “Recharge Influence Zone.”
- Label Groundwater Status Using Icons or Colors
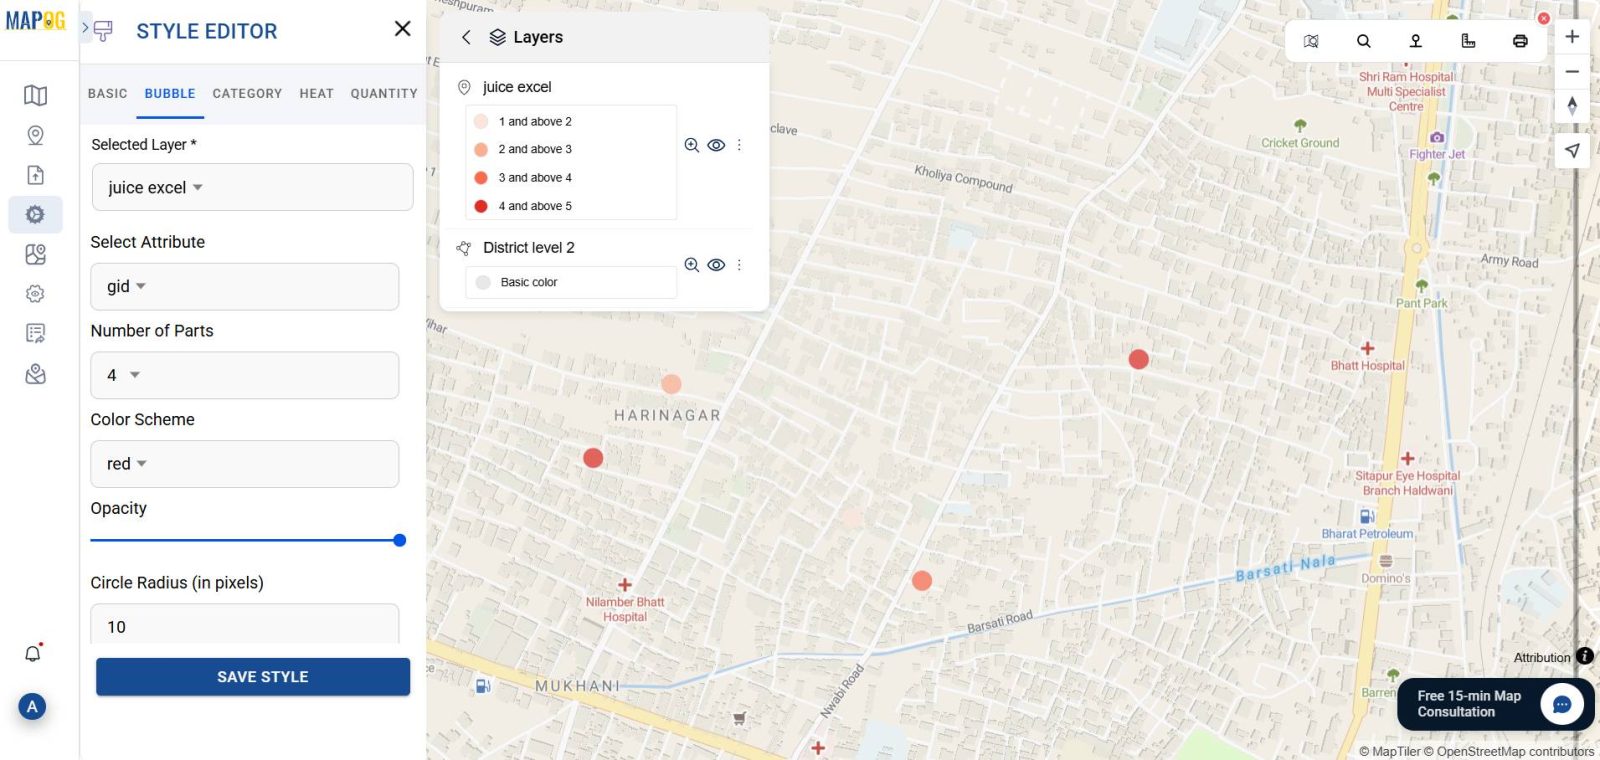
To further enhance map clarity, go to Style Layer → Unique Style and select the"Status"column.
🔴 Red for Decline
🟢 Green for Recharge
🟡 Yellow for Stable
5: Share and Act
- Once your map is ready, simply hit Share & Publish to make it accessible.
- Next, generate a shareable link that you can easily embed in government websites, NGO dashboards
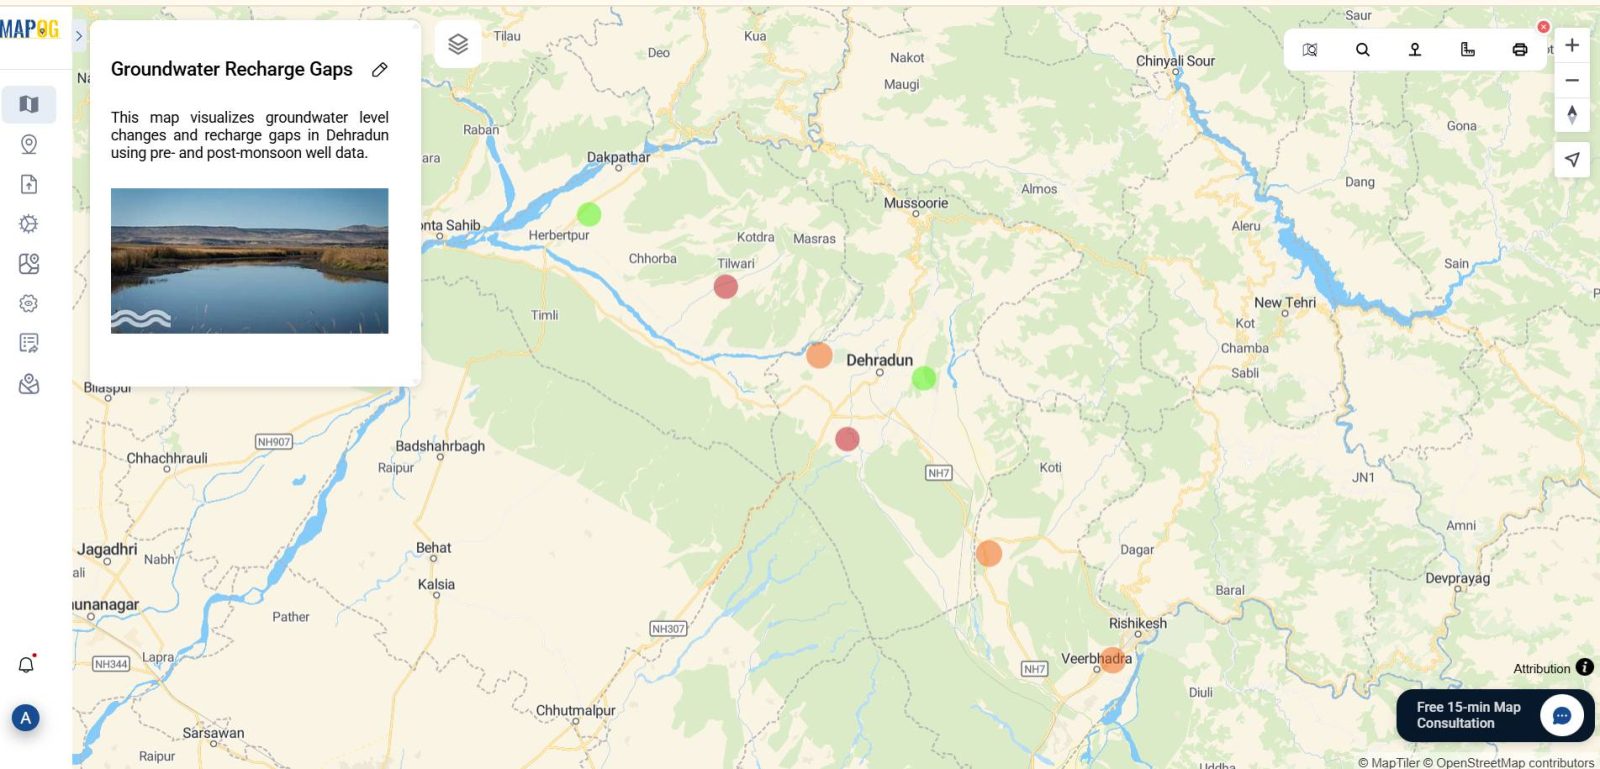
GIS DATA USED
Industry Applications of Groundwater Mapping Using GIS Tools
Groundwater mapping using GIS is crucial for:
- Urban Planning:
- Moreover, groundwater maps assist municipalities in strategically planning water
- Agriculture:
- In addition, GIS-based groundwater mapping supports farmers and rural water departments
- Environmental Conservation:
- Furthermore, NGOs and research institutions can use these maps to target specific regions for conservation projects
- Water Resource Management:
- Lastly, local water authorities benefit by using groundwater maps to balance demand and supply
A Step Toward Water-Smart Futures
Ultimately, mapping groundwater decline and recharge gaps using GIS tools like MAPOG empowers stakeholders with accurate, actionable insights.
Whether you’re involved in public administration, agriculture, research, or conservation, transforming groundwater data into map-based intelligence allows you to see patterns, track changes, and take informed actions.
Conclusion:
Using GIS to map groundwater decline and recharge gaps isn’t just a technical step; rather, it represents a critical and strategic approach to sustainable water management. In today’s world, where water scarcity and resource depletion pose significant challenges, leveraging GIS technology offers a powerful way to visualize and understand complex groundwater dynamics.
Fortunately, platforms like MAPOG simplify this entire process, making it accessible to a wide range of users—from water resource managers to local planners and environmentalists.
Exploring Our Previous Blogs
You might also be interested in exploring our detailed insights on Creating a Responsive EV Charging Map and GIS in Infrastructure Development and Road Network Analysis.
- Role of GIS In Irrigation Planning and Water Resource Management
- How GIS and Smart Mapping Reduce Urban Heat Islands
- GIS in Infrastructure Development and Road Network Analysis
- Flood Risk Mapping with Interactive Web Maps: SaaS Approach
- Optimizing Warehouse Location Selection with GIS for Supply Chain Efficiency