Water is the essence of agriculture, yet its availability varies dramatically across regions. In some areas, district-level irrigation mapping reveals well-developed irrigation networks that ensure a steady, reliable water supply to support year-round farming and crop diversity. These regions benefit from consistent agricultural productivity, reduced climate vulnerability, and greater economic stability.
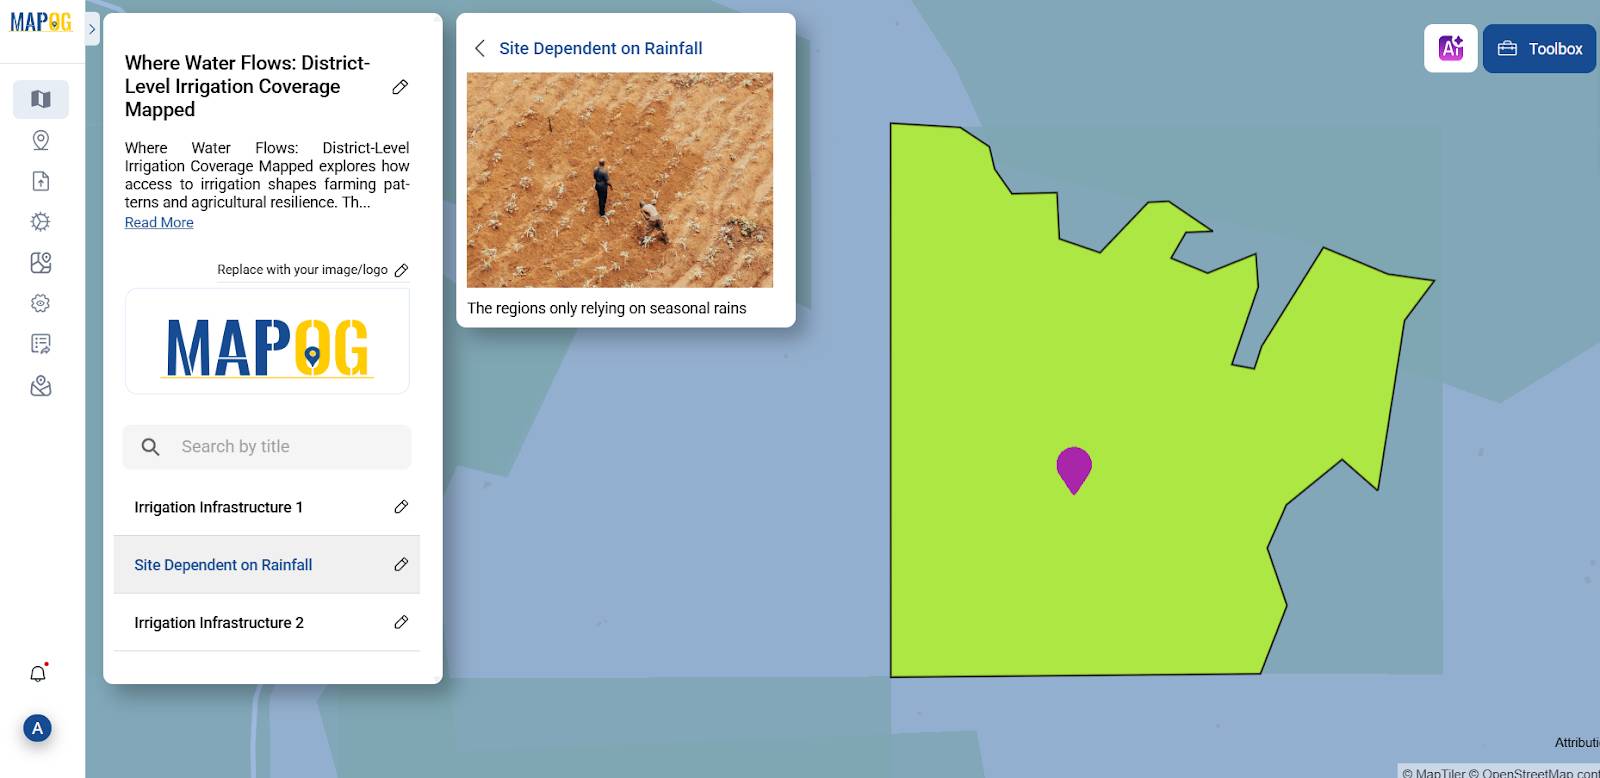
In contrast, however, many regions remain heavily dependent on seasonal rainfall, which leaves farmers increasingly vulnerable to droughts, erratic weather, and unpredictable harvests. As a result, water access—or the lack of it—not only shapes the agricultural landscape but also significantly influences livelihoods. Consequently, this highlights the urgent need for better and more efficient water resource planning.
Key Concept: Leveraging GIS for Smarter District-Level Irrigation Coverage & Water Management
By using spatial tools like buffer zones and layer styling, analysts can evaluate irrigation coverage across districts with impressive accuracy. Features such as MAPOG’s buffer tool and Add Story function simplify this intricate analysis, transforming it into an intuitive, accessible process for understanding regional water distribution and agricultural potential.
Step-by-Step Process for Mapping District-Level Irrigation Coverage
Let’s dive into a step by step process on how GIS supports District-Level Irrigation Coverage Mapping and Analysis using a real-life example with MAPOG.
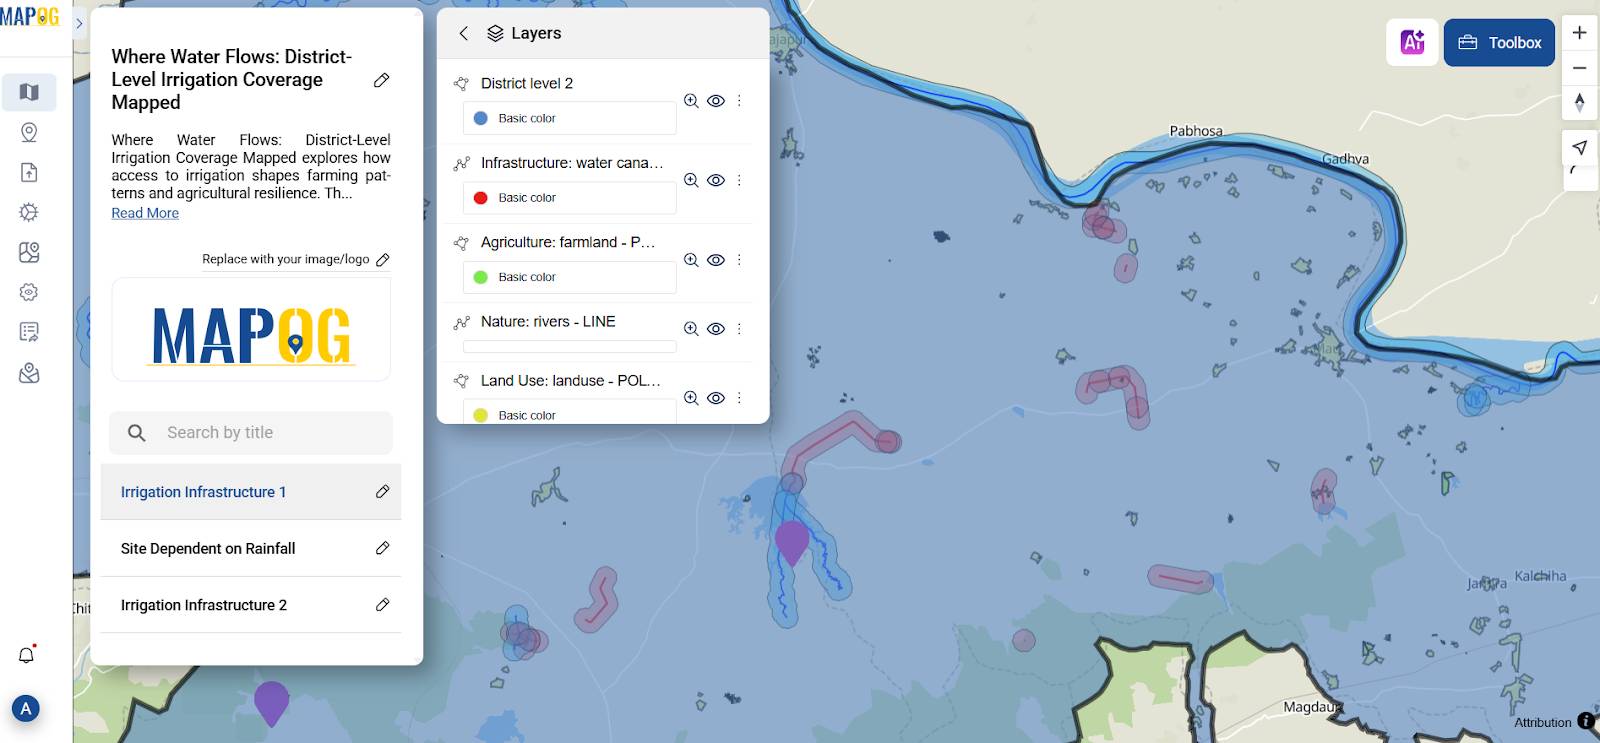
1 Selecting the Base map & Importing Key GIS Layers
Once you’re in the MAPOG interface, begin by choosing a suitable base map that aligns with your topic. Next, simply navigate to the GIS Data option to explore a wide range of preloaded spatial datasets. These ready-to-use layers can then be seamlessly added to your map, thus enabling the immediate beginning of your analysis.
Import critical datasets such as:
- District-level layer
- Infrastructure: Water canal
- Agriculture: Farmland
- Land use/Land Cover
- Nature: River
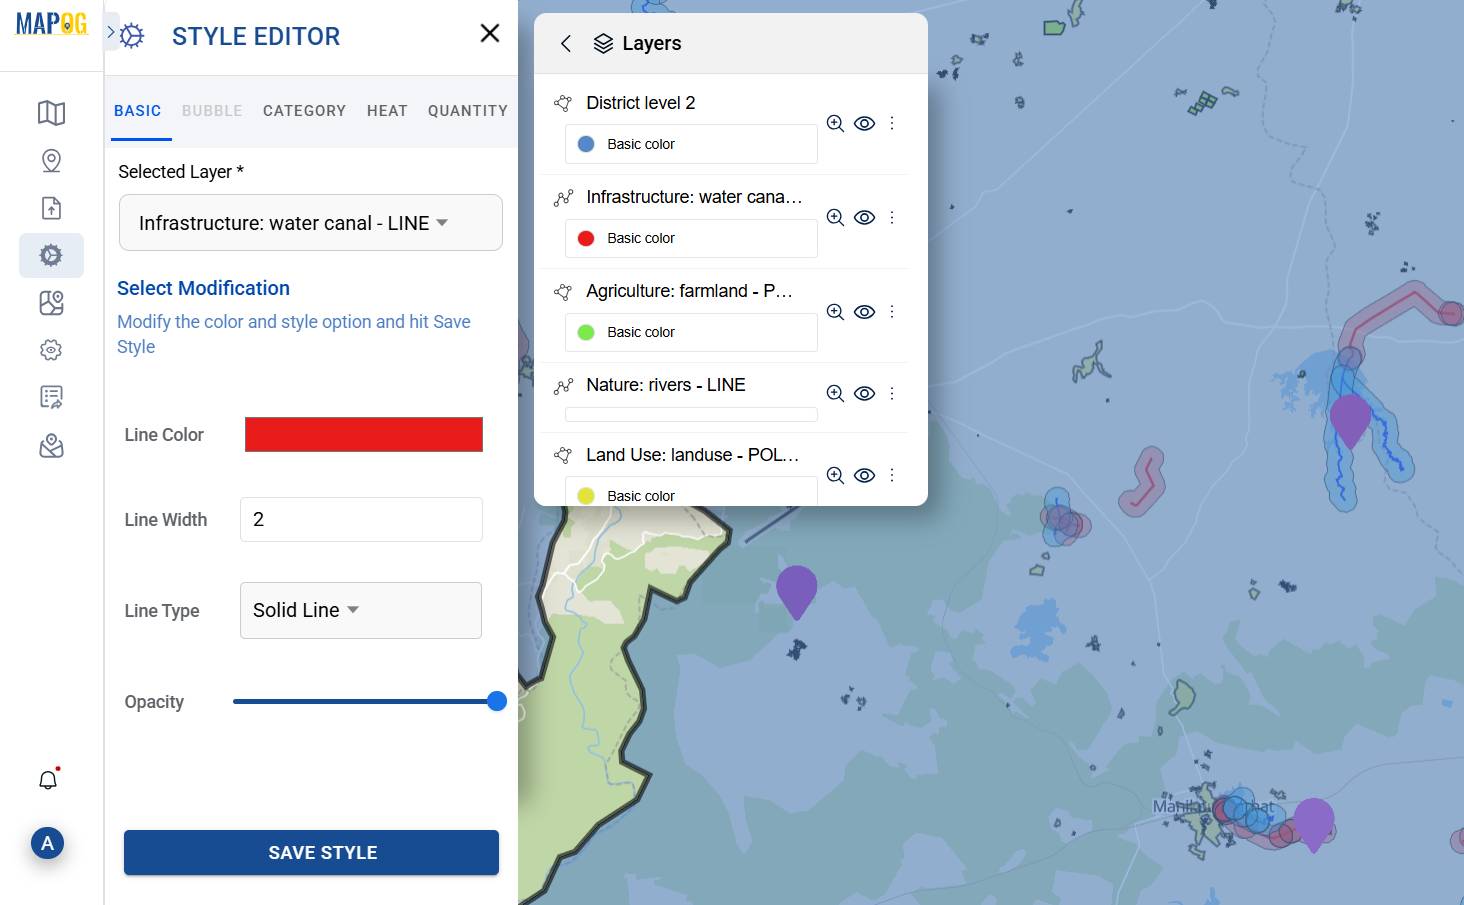
2. Styling Layers for Clarity in District-Level Irrigation Coverage & Water Management
Then, using the Style Editor from the action button, I can customize each layer to enhance the map’s readability. For instance, in the context of irrigation coverage mapping, I might shade irrigated farmland in green, highlight canal networks in red, and display water bodies in blue. As a result, this visual distinction between zones makes it much easier to recognize irrigation patterns and understand spatial differences at a glance.
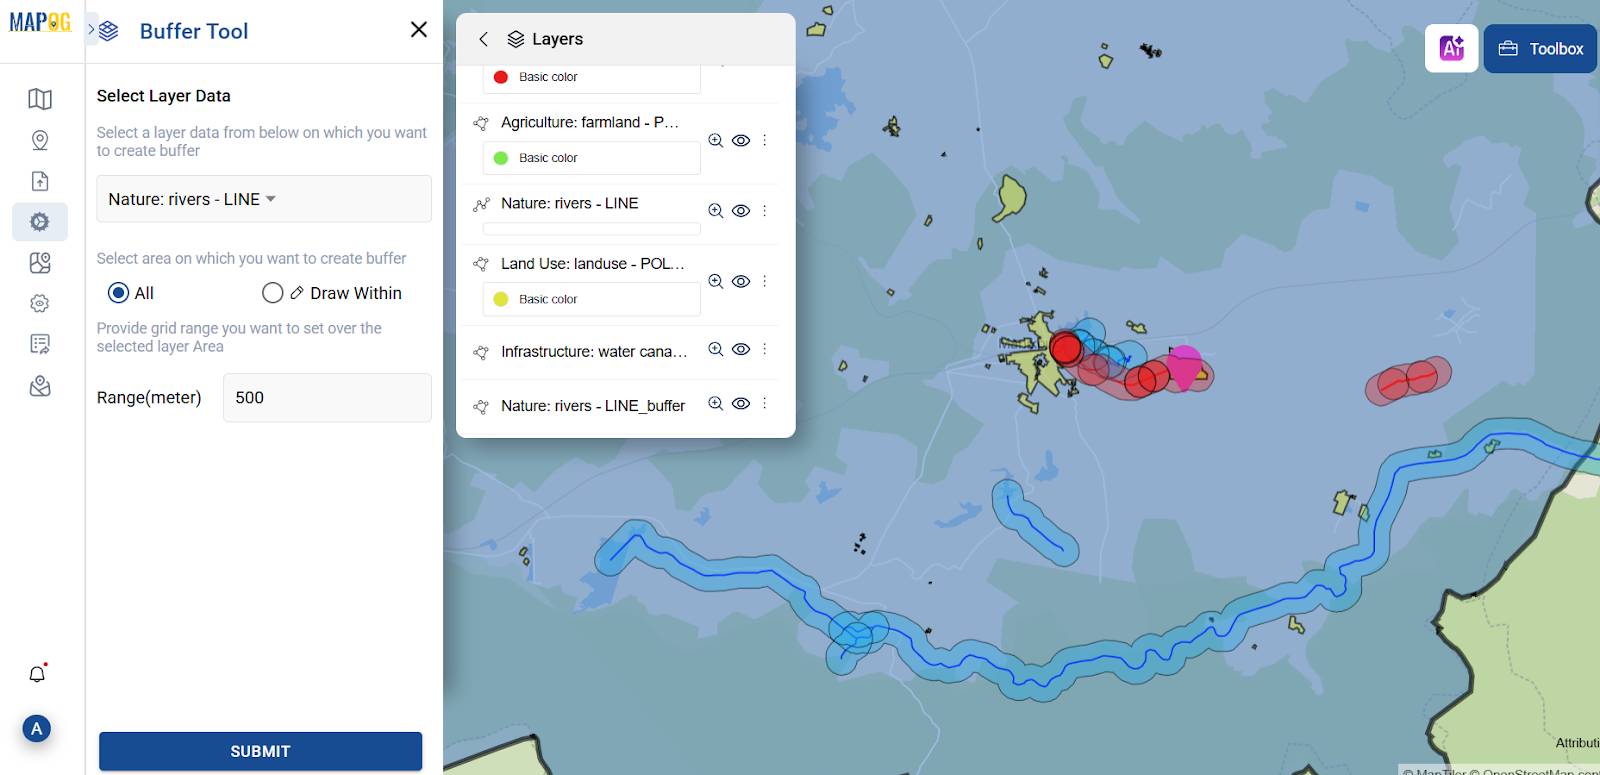
3. Drawing Buffer Zones Around Important Features
This is where MAPOG’s buffer tool proves especially useful. Through the process data panel on the left, you can easily access the Buffer Tool and begin creating buffer zones. For example, you might generate a 500-meter buffer around existing canals or water sources.
Consequently, these buffers help identify areas with adequate irrigation access and, at the same time, highlight regions that may need additional infrastructure. This, in turn, enables planners to make informed decisions about improving water distribution for agriculture.
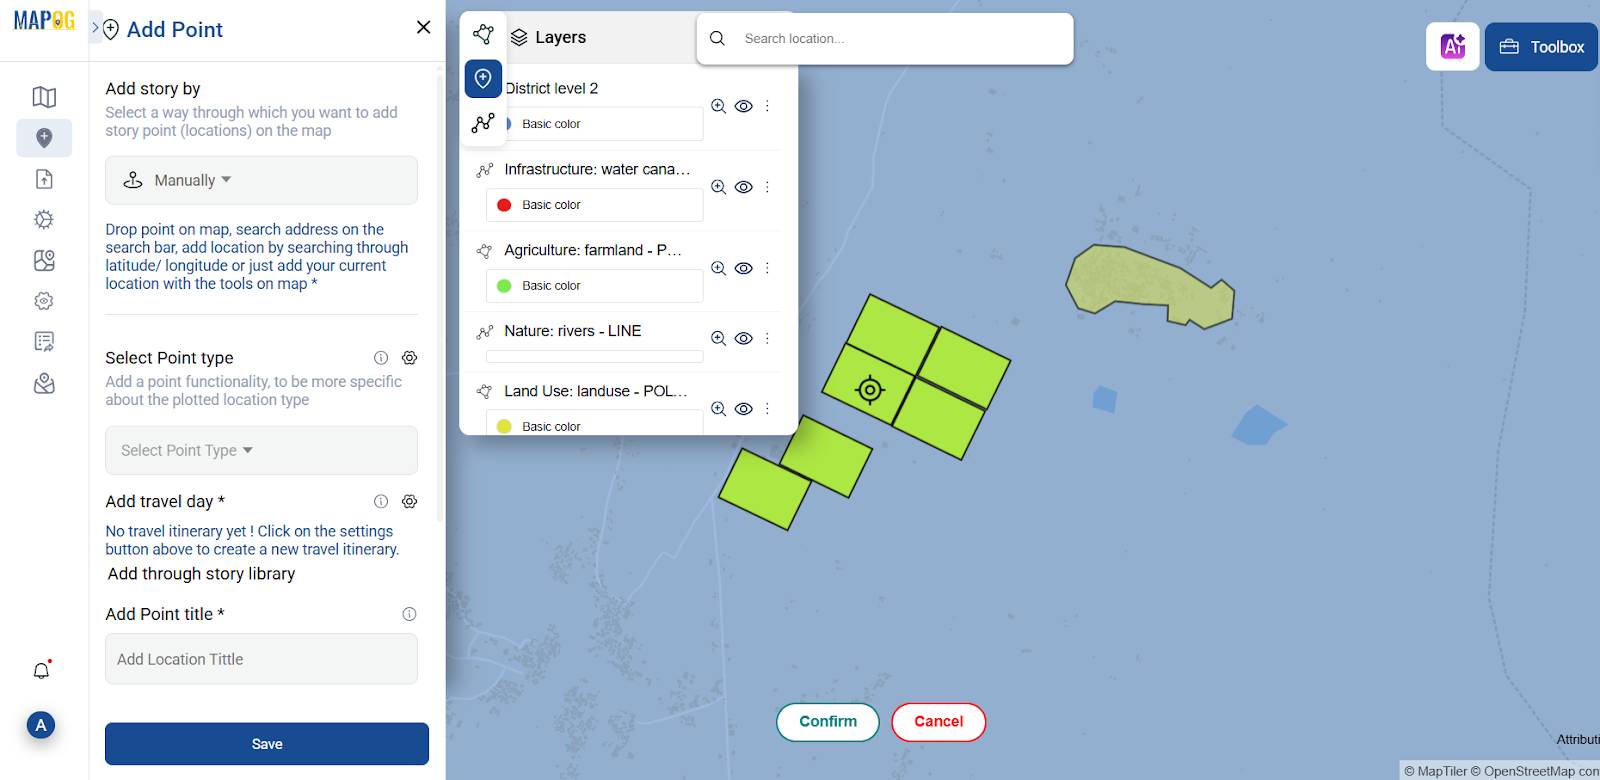
Suggesting the Best Locations for District-Level Irrigation Coverage with GIS
Once the buffer zones are in place, the “Add Point” feature in MAPOG’s Add Story section becomes a valuable tool for highlighting potential areas for improved irrigation infrastructure. Using the insights gained from the spatial analysis, I can manually pinpoint suitable locations such as areas lacking access to nearby canals or water bodies and also showcase regions having proper irrigation systems . Furthermore, each point can be customized with a title, a short description, and even images, helping to convey the context and reasoning behind each suggestion. As a result, this approach makes it easy to present irrigation significances in a clear, engaging, and meaningful way.
Industry Applications and Key Benefits
Ultimately, mapping district-level irrigation coverage using GIS offers actionable insights for better resource planning, agricultural resilience, and climate adaptation. In addition, it supports data-driven decisions across sectors aiming to optimize water use and strengthen food systems.
- Agriculture & Agritech: Optimizing crop planning and irrigation scheduling.
- Water Resource Management: Planning infrastructure like canals and reservoirs.
- Government & Policy Making: Informed decisions for equal resource distribution.
- Climate & Environmental Agencies: Monitoring drought-prone areas and climate impacts.
By effectively combining storytelling with spatial data tools like MAPOG, professionals can visualize, communicate, and refine irrigation coverage insights across a district. Consequently, this integration allows users to transform complex data into clear, compelling narratives—highlighting areas with strong irrigation networks, identifying gaps in coverage, and showcasing the impact on agricultural productivity.
GIS data used :
- District-level layer
- Infrastructure: Water canal
- Agriculture: Farmland
- Land use/Land Cover
- Nature: River
Ever wonder how to align irrigation systems with the actual needs of different crops? CREATE MAP — How to Use GIS for Mapping Zones With Specific Farming Fields: Planning Sustainable Irrigation. Explore how GIS technology helps identify crop-specific zones, analyze their irrigation requirements, and support targeted, efficient water management.
Conclusion: Let GIS Guide Your District-Level Irrigation Coverage Planning
From visualizing farmland distribution to identifying underserved zones through buffer analysis, GIS is revolutionizing irrigation planning by turning it into a clear, data-driven process. Moreover, with tools like MAPOG’s Add Story and Buffer features, even non-experts can easily build insightful spatial narratives that, in turn, support sustainable water management and smarter agricultural strategies.
So, the next time you’re assessing irrigation coverage or planning new infrastructure, let the maps show you the way.