Interactive Maps for Education & Research
Education & Research becomes more interactive with MAPOG. Through visual maps, complex ideas become easier to grasp, lessons more engaging, and research more impactful.
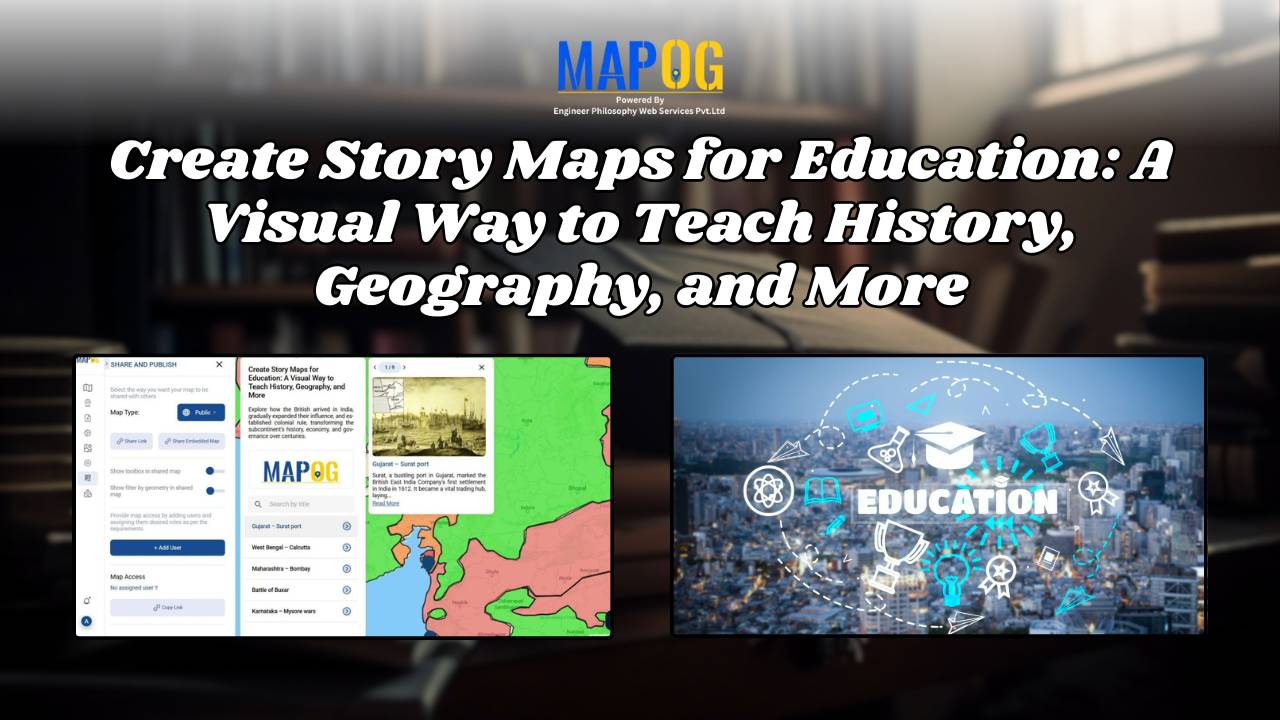
- Curriculum Integration: Teach Geography, History, Science, or Arts through map-based storytelling, real case studies, and visual examples.
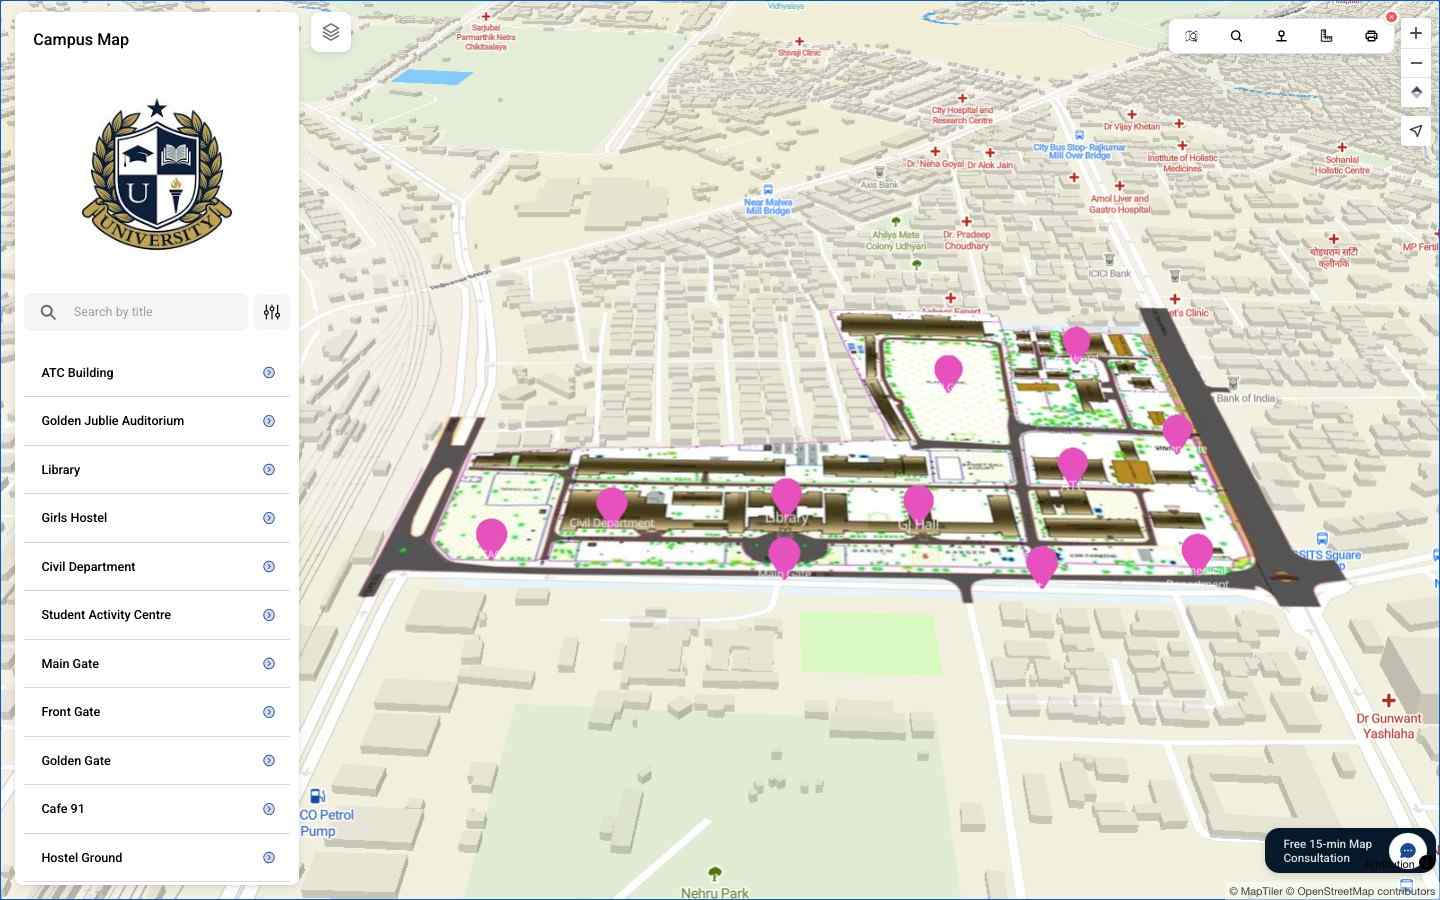
- Campus Navigation: Offer digital maps for schools, colleges, and universities to help students and visitors explore campuses with ease.
- Institution Networks: Showcase branches, affiliated institutions, or research centers in one unified view.
- Student Engagement: Add images, videos, timelines, and real-world examples to make learning interactive and memorable.
- Research Collaboration: Visualize datasets, highlight research findings, and create interactive knowledge-sharing maps.
- Flexible Sharing: Embed maps on websites, share with students, or keep them private for internal use.
How Education & Research Institutions Use Interactive Maps
Curriculum Mapping
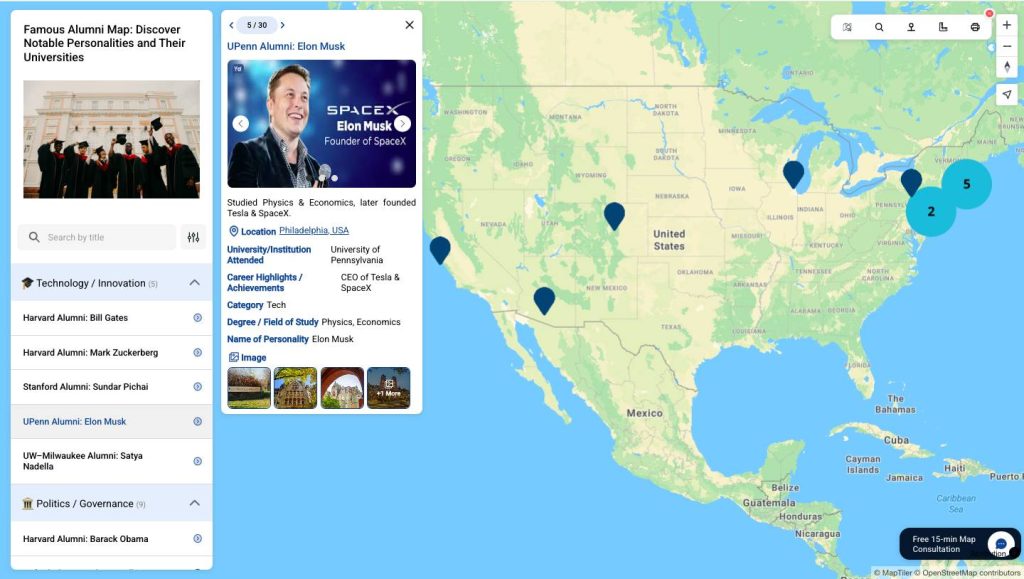
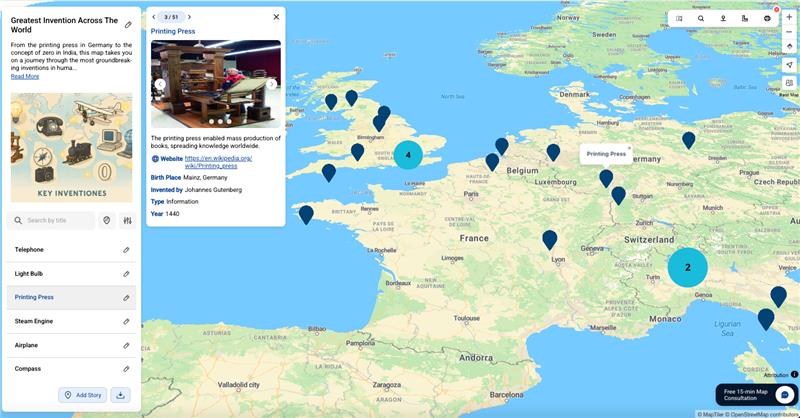
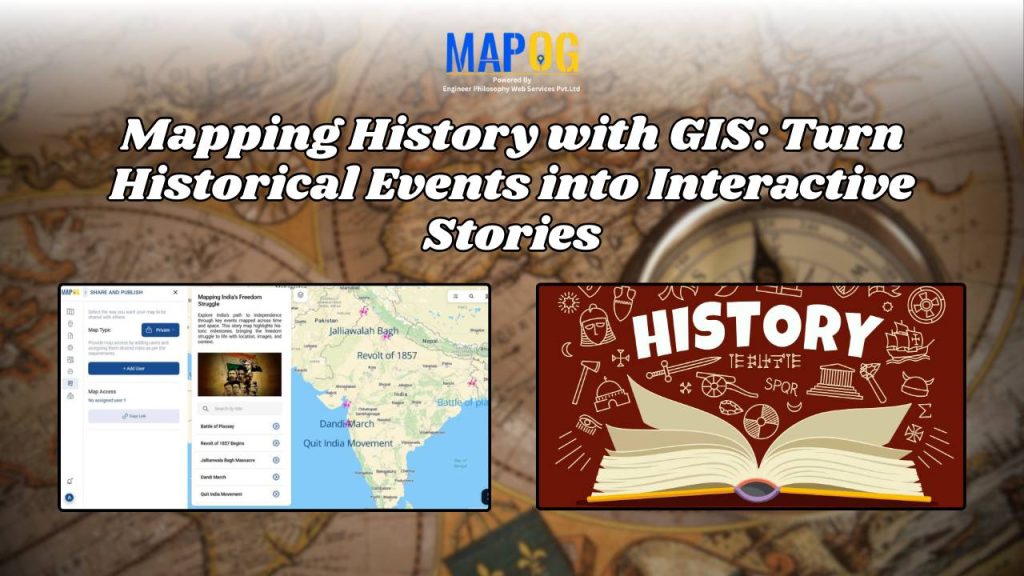
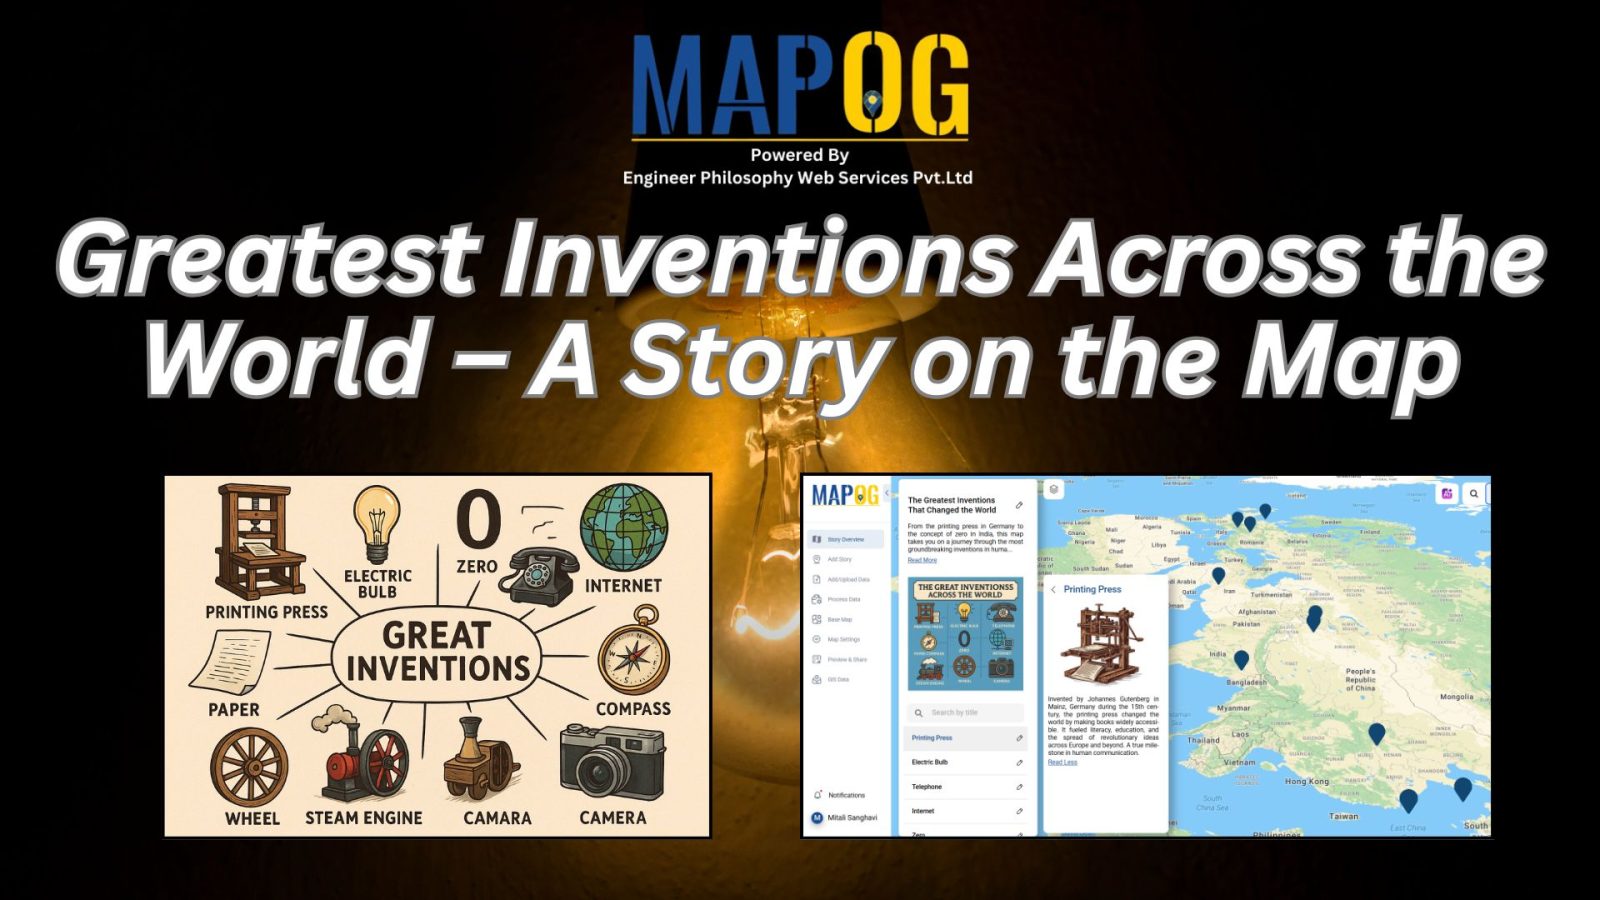
Visualize history, geography, civics, disaster management, or any subject through interactive maps. Turn case studies into stories that students can explore spatially.
See exampleCampus & Facilities Map
Create interactive maps of your school, college, or university campus. Highlight classrooms, labs, libraries, hostels, sports areas, and other facilities for better orientation.
See exampleInstitution Chains & Networks
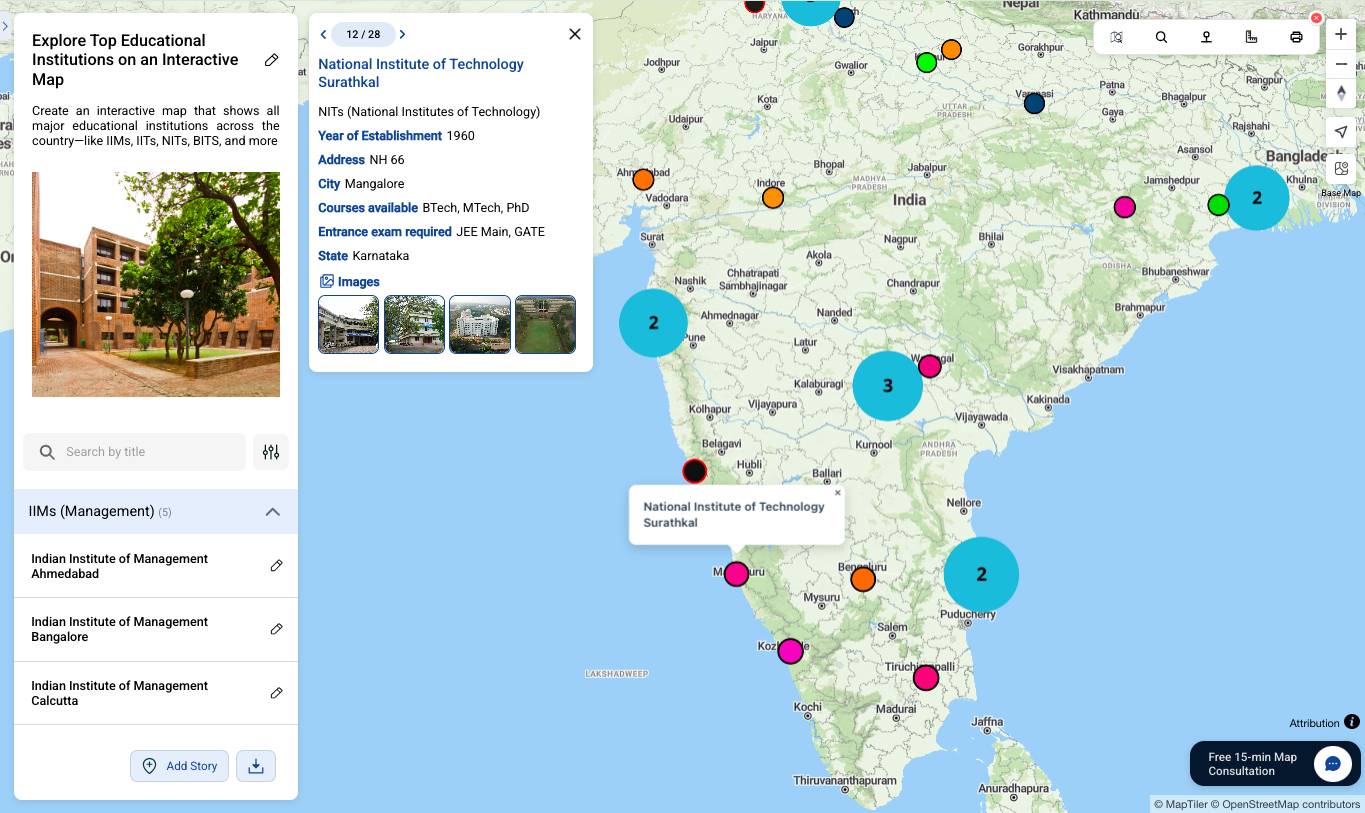
Showcase locations of multiple campuses, coaching centers, or educational branches across cities or countries. Help students and parents find the nearest centers easily.
See exampleResearch & Student Projects
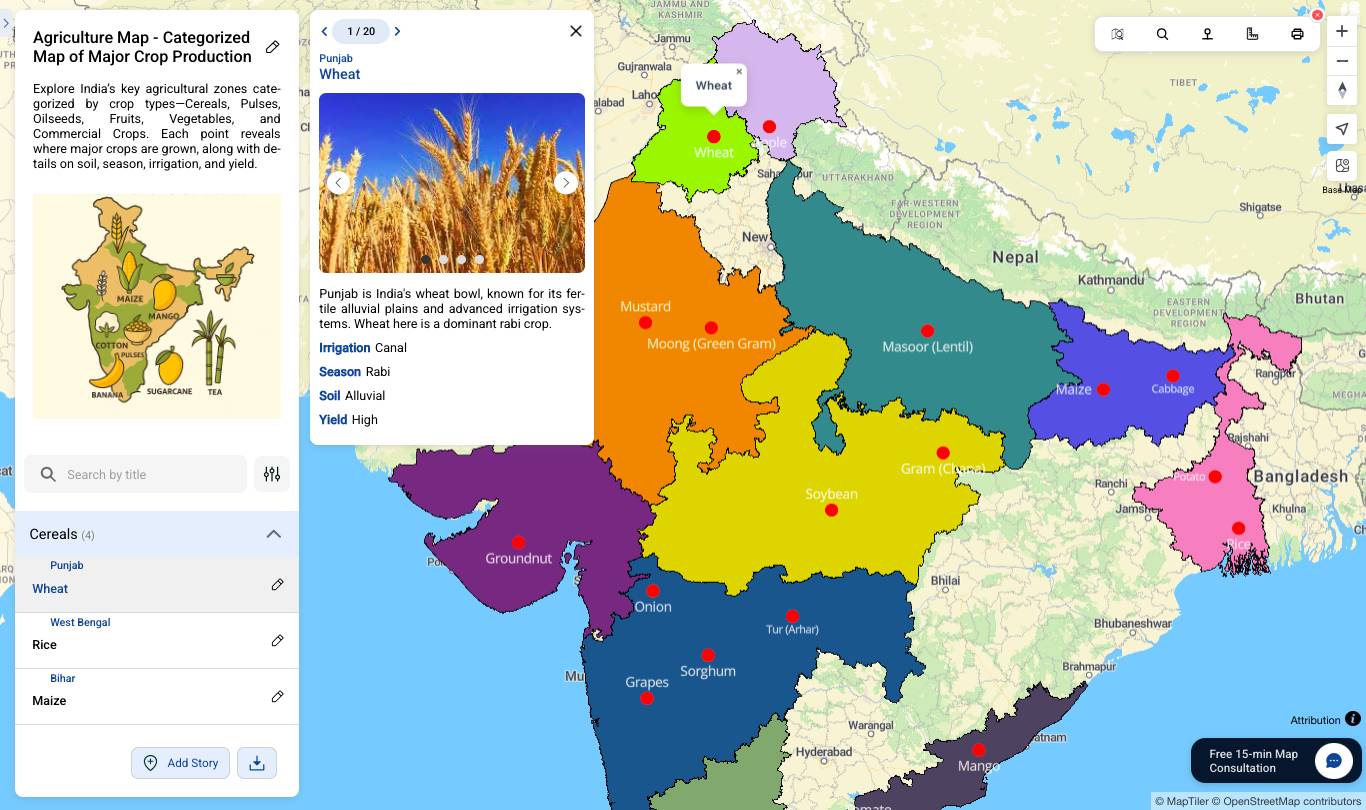
Map student research projects. Visualize data, journeys, or research findings interactively for better understanding and engagement.
See exampleWho uses MAPOG in Education & Research?
MAPOG is an interactive mapping platform that empowers both educators and researchers. From schools and colleges to universities, labs, and research organizations, it helps visualize data, enhance learning, and simplify complex studies through map-based insights.
- Schools & Colleges – Create interactive campus maps, plan facilities, and make orientation easier for students and visitors.
- Universities & Research Institutes – Map research data, field studies, surveys, or geographic trends for deeper analysis and collaboration.
- Teachers & Curriculum Designers – Integrate Geography, History, Environmental Studies, or Disaster Management into interactive lessons and case studies.
- Education Planners & Administrators – Analyse networks of institutions and regional education data for informed decision-making.
- Students & Researchers – Present projects, thesis work, and findings with interactive maps that bring clarity to complex datasets.
From classroom learning to advanced research, MAPOG bridges education and research by turning data into interactive, easy-to-understand experiences.
How to Create Interactive Maps for Education & Research Institutions
Customize Your Campus
Highlight classrooms, labs, libraries, hostels, and sports areas. Easily add icons and colors to match your school or college branding.
Visualize Stories & Concepts
Map any story, concept, or lesson to help students understand better. Add images, videos, and links to make learning interactive and engaging.
Share, Embed, or Keep it Private
Share interactive maps with students, parents, or staff, or keep them private for internal use or control who can see. Embed maps on your website.
Featured Education & Research Blogs
Explore MoreRead our latest Education articles and tips on integrating interactive maps in schools, colleges, and coaching centers.

Frequently Asked Questions
Can we bulk upload campus locations or research data?
Yes. Institutions can upload large datasets such as campuses, labs, or survey results using CSV files for easy management.
Can students add multimedia elements like images or videos?
Students can enhance their research projects by embedding images, videos, text, and external links directly on the map.
Is MAPOG mobile-friendly for students and educators?
Yes. All maps are responsive and optimized for mobile and desktop, ensuring access anywhere—classrooms, labs, or fieldwork.
Is coding knowledge required to use MAPOG?
No coding skills are needed. MAPOG is designed with an intuitive interface for educators, researchers, and students.
Can MAPOG be used by both small schools and large universities?
Yes. MAPOG scales seamlessly, supporting single schools, research groups, or nationwide academic institutions.
Can we create private maps for internal classroom or research use?
Yes. Access can be restricted so only selected students, faculty, or research groups can view or edit the map.
Can interactive maps be used for thesis or research projects?
Absolutely. Researchers and students can create interactive visualizations for case studies, historical analysis, or field surveys.
Can interactive maps be embedded in academic websites or presentations?
Definitely. MAPOG maps can be embedded in university portals, research papers, or presentations with a simple embed code.
Can maps display multiple campuses or study sites in one place?
Yes. MAPOG allows combining multiple campuses, research labs, or field study sites on a single interactive map.
What are you waiting for?